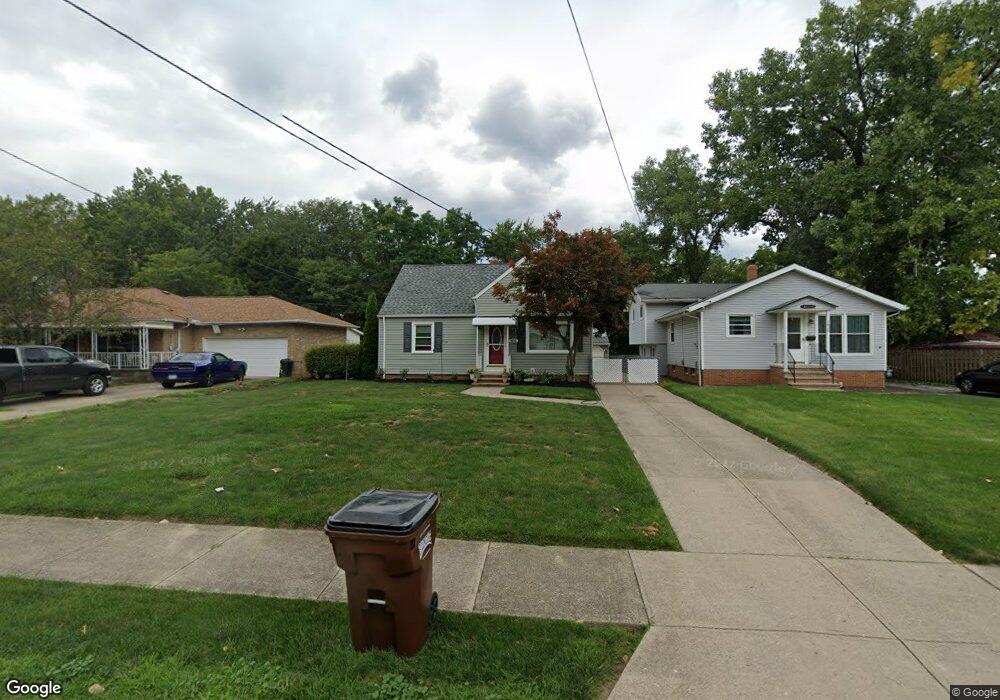
1616 Carlton Rd Cleveland, OH 44134
Estimated Value: $182,000 - $214,000
3
Beds
1
Bath
1,184
Sq Ft
$168/Sq Ft
Est. Value
About This Home
This home is located at 1616 Carlton Rd, Cleveland, OH 44134 and is currently estimated at $198,713, approximately $167 per square foot. 1616 Carlton Rd is a home located in Cuyahoga County with nearby schools including Shiloh Middle School, John Muir Elementary School, and Parma High School.
Ownership History
Date
Name
Owned For
Owner Type
Purchase Details
Closed on
May 6, 2019
Sold by
Ryai Marsha A
Bought by
The Marsha Ryai Family Trust
Current Estimated Value
Purchase Details
Closed on
Sep 10, 2018
Sold by
Ryai Marsha A and Ryai David I
Bought by
Ryai Marsha A
Purchase Details
Closed on
Nov 2, 2015
Sold by
Ryai Marsha A and Ryai David J
Bought by
Ryai Marsha A and Ryai David J
Purchase Details
Closed on
Aug 9, 2006
Sold by
Yankovich Joseph
Bought by
Ryai Marsha A and Ryai David J
Home Financials for this Owner
Home Financials are based on the most recent Mortgage that was taken out on this home.
Original Mortgage
$97,000
Outstanding Balance
$58,522
Interest Rate
6.85%
Mortgage Type
Purchase Money Mortgage
Estimated Equity
$140,191
Purchase Details
Closed on
Oct 6, 1983
Sold by
Yankovich Jos R and Yankovich Alicia
Bought by
Yakovich Alicia
Purchase Details
Closed on
Jan 1, 1975
Bought by
Yankovich Jos R and Yankovich Alicia
Create a Home Valuation Report for This Property
The Home Valuation Report is an in-depth analysis detailing your home's value as well as a comparison with similar homes in the area
Home Values in the Area
Average Home Value in this Area
Purchase History
| Date | Buyer | Sale Price | Title Company |
|---|---|---|---|
| The Marsha Ryai Family Trust | -- | None Available | |
| Ryai Marsha A | -- | None Available | |
| Ryai Marsha A | -- | Attorney | |
| Ryai Marsha A | $107,000 | Barristers Title Agency | |
| Yakovich Alicia | -- | -- | |
| Yankovich Jos R | -- | -- |
Source: Public Records
Mortgage History
| Date | Status | Borrower | Loan Amount |
|---|---|---|---|
| Open | Ryai Marsha A | $97,000 |
Source: Public Records
Tax History Compared to Growth
Tax History
| Year | Tax Paid | Tax Assessment Tax Assessment Total Assessment is a certain percentage of the fair market value that is determined by local assessors to be the total taxable value of land and additions on the property. | Land | Improvement |
|---|---|---|---|---|
| 2024 | $3,350 | $53,865 | $12,775 | $41,090 |
| 2023 | $2,815 | $38,680 | $9,100 | $29,580 |
| 2022 | $2,789 | $38,680 | $9,100 | $29,580 |
| 2021 | $2,866 | $38,680 | $9,100 | $29,580 |
| 2020 | $2,662 | $31,710 | $7,460 | $24,260 |
| 2019 | $2,549 | $90,600 | $21,300 | $69,300 |
| 2018 | $2,406 | $31,710 | $7,460 | $24,260 |
| 2017 | $2,409 | $27,690 | $6,090 | $21,600 |
| 2016 | $2,395 | $27,690 | $6,090 | $21,600 |
| 2015 | $2,398 | $27,690 | $6,090 | $21,600 |
| 2014 | $2,398 | $29,760 | $6,550 | $23,210 |
Source: Public Records
Map
Nearby Homes
- 1414 Dartmoor Ave
- 1319 Dartmoor Ave
- 5961 Broadview Rd
- 101 Stonegate Cir
- 5651 Broadview Rd Unit A1
- 1415 Lorimer Rd
- 100 E Decker Dr
- 5850 S Park Blvd
- 2010 Grantwood Dr
- 281 Crescent Ridge Dr
- 5550 Sandpiper Dr Unit 290
- 664 E Dawnwood Dr
- 6185 Yorktown Dr
- 1417 Roanoke Dr
- 5981 Northview Dr
- 2821 Parklane Dr
- 2907 Liggett Dr
- 1100 Winchester Dr
- 2922 Commonwealth Dr
- 2302 Brookdale Ave
- 1610 Carlton Rd
- 1700 Carlton Rd
- 1720 Carlton Rd
- 2103 Carlton Rd
- 5890 Broadview Rd
- 1724 Carlton Rd
- 1703 Carlton Rd
- 5898 Broadview Rd
- 1728 Carlton Rd
- 1721 Carlton Rd
- 5902 Broadview Rd
- 5910 Broadview Rd
- 5910 Broadview Rd Unit 1
- 5883 Broadview Rd
- 5893 Broadview Rd
- 5912 Broadview Rd
- 1507 Englewood Dr
- 1800 Valewood Dr
- 5899 Broadview Rd
- 1419 Dawnwood Dr