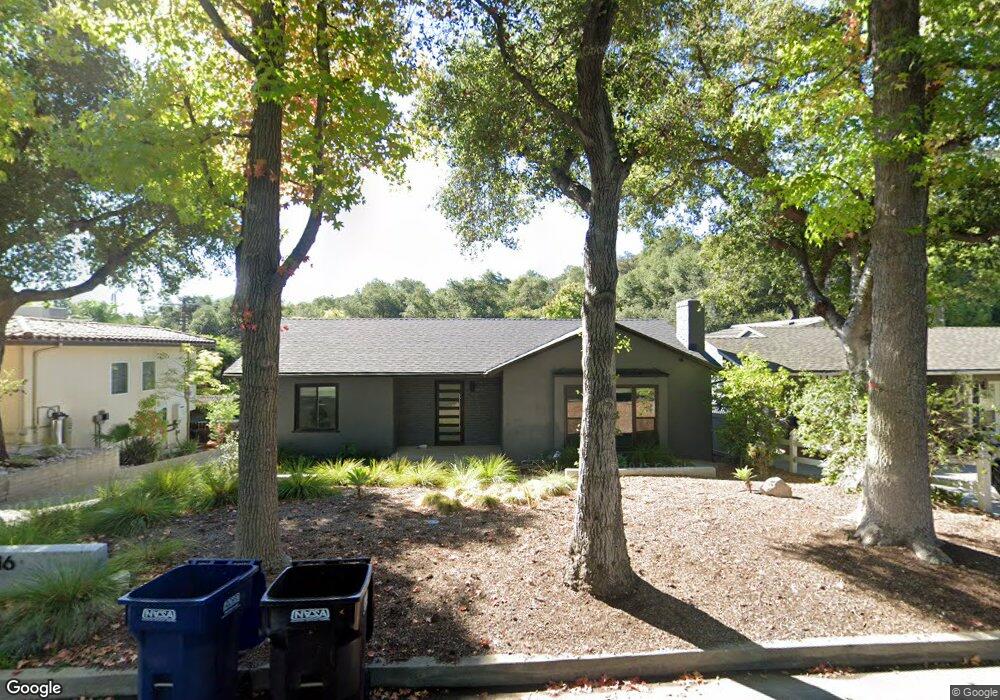
1616 Leycross Dr La Canada Flintridge, CA 91011
Estimated Value: $1,333,000 - $1,764,000
4
Beds
2
Baths
1,974
Sq Ft
$809/Sq Ft
Est. Value
About This Home
This home is located at 1616 Leycross Dr, La Canada Flintridge, CA 91011 and is currently estimated at $1,596,726, approximately $808 per square foot. 1616 Leycross Dr is a home located in Los Angeles County with nearby schools including La Canada Elementary School, La Canada High School, and La Canada Preparatory School.
Ownership History
Date
Name
Owned For
Owner Type
Purchase Details
Closed on
Nov 27, 2012
Sold by
Park Patrick Taehae and Park Jungmi
Bought by
Park Patrick Taehae and Park Jungmi
Current Estimated Value
Purchase Details
Closed on
Jul 7, 2012
Sold by
Oh Kwang S and Oh Jung Yeol
Bought by
Park Patrick Taehae and Park Jungmi
Home Financials for this Owner
Home Financials are based on the most recent Mortgage that was taken out on this home.
Original Mortgage
$417,000
Outstanding Balance
$63,886
Interest Rate
3.62%
Mortgage Type
New Conventional
Estimated Equity
$1,532,840
Purchase Details
Closed on
Jul 6, 2012
Sold by
Oh Jessica
Bought by
Oh Jason
Home Financials for this Owner
Home Financials are based on the most recent Mortgage that was taken out on this home.
Original Mortgage
$417,000
Outstanding Balance
$63,886
Interest Rate
3.62%
Mortgage Type
New Conventional
Estimated Equity
$1,532,840
Purchase Details
Closed on
Sep 6, 2007
Sold by
Oh Kwang Sup and Oh Jung Yeol
Bought by
Oh Kwang Sup
Create a Home Valuation Report for This Property
The Home Valuation Report is an in-depth analysis detailing your home's value as well as a comparison with similar homes in the area
Home Values in the Area
Average Home Value in this Area
Purchase History
| Date | Buyer | Sale Price | Title Company |
|---|---|---|---|
| Park Patrick Taehae | -- | None Available | |
| Park Patrick Taehae | $785,000 | Provident Title Company | |
| Oh Jason | -- | Provident Title Company | |
| Oh Kwang Sup | -- | None Available |
Source: Public Records
Mortgage History
| Date | Status | Borrower | Loan Amount |
|---|---|---|---|
| Open | Park Patrick Taehae | $417,000 |
Source: Public Records
Tax History Compared to Growth
Tax History
| Year | Tax Paid | Tax Assessment Tax Assessment Total Assessment is a certain percentage of the fair market value that is determined by local assessors to be the total taxable value of land and additions on the property. | Land | Improvement |
|---|---|---|---|---|
| 2025 | $11,296 | $966,661 | $773,332 | $193,329 |
| 2024 | $11,296 | $947,708 | $758,169 | $189,539 |
| 2023 | $10,964 | $929,126 | $743,303 | $185,823 |
| 2022 | $10,568 | $910,909 | $728,729 | $182,180 |
| 2021 | $10,367 | $893,049 | $714,441 | $178,608 |
| 2019 | $10,049 | $866,562 | $693,251 | $173,311 |
| 2018 | $9,792 | $849,571 | $679,658 | $169,913 |
| 2016 | $9,442 | $816,583 | $653,267 | $163,316 |
| 2015 | $9,314 | $804,318 | $643,455 | $160,863 |
| 2014 | $9,186 | $788,563 | $630,851 | $157,712 |
Source: Public Records
Map
Nearby Homes
- 4467 Ardara Place
- 1237 Descanso Dr
- 1304 Padres Trail
- 4639 El Camino Corto
- 2048 Valderas Dr
- 4720 Olive Ct
- 4644 Hillard Ave
- 4825 Angeles Crest Hwy
- 909 Coral Way
- 3226 Menlo Dr
- 2222 Montrose Ave Unit G
- 4938 Angeles Crest Hwy
- 4430 Rosebank Dr
- 2102 La Canada Crest Dr Unit B
- 5123 Caroli Ln
- 2249 Montrose Ave Unit 7
- 3470 Downing Ave
- 3328 N Verdugo Rd
- 1116 Flintridge Ave
- 1929 Lyans Dr
- 1614 Leycross Dr
- 1622 Leycross Dr
- 1628 Leycross Dr
- 1520 Descanso Dr
- 1514 Descanso Dr
- 1617 Leycross Dr
- 1615 Leycross Dr
- 1623 Leycross Dr
- 1500 Descanso Dr
- 1530 Descanso Dr
- 1630 Leycross Dr
- 1627 Leycross Dr
- 1532 Descanso Dr
- 1631 Leycross Dr
- 1618 Verdugo Blvd
- 1624 Verdugo Blvd
- 1614 Verdugo Blvd
- 1538 Descanso Dr
- 1628 Verdugo Blvd
- 4130 Lanterman Ln