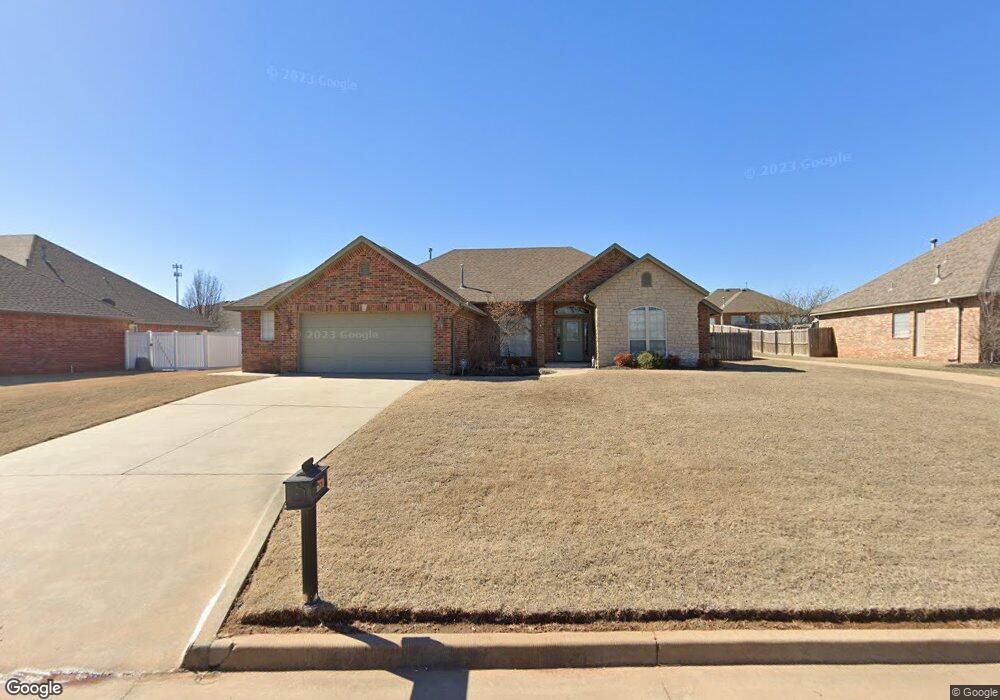
1616 Pecan Crossing Dr Shawnee, OK 74804
Estimated Value: $339,000 - $366,000
3
Beds
2
Baths
2,200
Sq Ft
$159/Sq Ft
Est. Value
About This Home
This home is located at 1616 Pecan Crossing Dr, Shawnee, OK 74804 and is currently estimated at $348,853, approximately $158 per square foot. 1616 Pecan Crossing Dr is a home located in Pottawatomie County.
Ownership History
Date
Name
Owned For
Owner Type
Purchase Details
Closed on
May 25, 2022
Sold by
Cook Tammy Sue
Bought by
Cook Tammy Sue and Kimrey Tyler
Current Estimated Value
Purchase Details
Closed on
Feb 20, 2014
Sold by
Cook Tammy S and Kimrey Tammy Sue
Bought by
Cook Tammy S
Home Financials for this Owner
Home Financials are based on the most recent Mortgage that was taken out on this home.
Original Mortgage
$196,000
Interest Rate
4.36%
Mortgage Type
New Conventional
Purchase Details
Closed on
Feb 27, 2007
Sold by
Tom Brown Homes Inc
Bought by
Kimrey Tammy Sue
Purchase Details
Closed on
Jul 14, 2006
Sold by
Windmill Development Llc
Bought by
Tom Brown Homes Inc
Home Financials for this Owner
Home Financials are based on the most recent Mortgage that was taken out on this home.
Original Mortgage
$173,600
Interest Rate
6.66%
Mortgage Type
Construction
Create a Home Valuation Report for This Property
The Home Valuation Report is an in-depth analysis detailing your home's value as well as a comparison with similar homes in the area
Home Values in the Area
Average Home Value in this Area
Purchase History
| Date | Buyer | Sale Price | Title Company |
|---|---|---|---|
| Cook Tammy Sue | -- | None Listed On Document | |
| Cook Tammy S | -- | Fidelity National | |
| Kimrey Tammy Sue | $208,000 | None Available | |
| Tom Brown Homes Inc | $28,500 | None Available |
Source: Public Records
Mortgage History
| Date | Status | Borrower | Loan Amount |
|---|---|---|---|
| Previous Owner | Cook Tammy S | $196,000 | |
| Previous Owner | Tom Brown Homes Inc | $173,600 |
Source: Public Records
Tax History Compared to Growth
Tax History
| Year | Tax Paid | Tax Assessment Tax Assessment Total Assessment is a certain percentage of the fair market value that is determined by local assessors to be the total taxable value of land and additions on the property. | Land | Improvement |
|---|---|---|---|---|
| 2025 | $2,538 | $28,898 | $3,420 | $25,478 |
| 2024 | $2,493 | $28,056 | $3,420 | $24,636 |
| 2023 | $2,493 | $27,239 | $3,420 | $23,819 |
| 2022 | $2,447 | $27,239 | $3,420 | $23,819 |
| 2021 | $2,469 | $27,239 | $3,420 | $23,819 |
| 2020 | $2,523 | $27,861 | $3,420 | $24,441 |
| 2019 | $2,583 | $28,198 | $3,420 | $24,778 |
| 2018 | $2,540 | $27,591 | $3,420 | $24,171 |
| 2017 | $2,443 | $26,787 | $3,420 | $23,367 |
| 2016 | $2,495 | $27,049 | $3,420 | $23,629 |
| 2015 | $2,155 | $26,480 | $3,420 | $23,060 |
| 2014 | $2,090 | $25,709 | $3,420 | $22,289 |
Source: Public Records
Map
Nearby Homes
- 1506 Windmill Ridge Dr
- 1809 Hunters Ridge Dr
- 1609 Cedar Bend Ct
- 1900 Cobblestone Dr
- 2309 Pinehurst Ct
- 2713 Old Towne Trail
- 1262 Augusta Ct
- 2400 Augusta
- 1181 Augusta Ct
- 1836 N Bryan Ave
- 1213 Muirfield Dr
- 1217 Inverness Cir
- 42 Pam Dr
- 17 Mojave Dr
- 17 Granada Dr
- 0 Robinwood Place
- 9 Dustin Cir
- 17 Sequoyah Blvd
- 2500 E Highland St
- 1301 E Independence St
- 1615 Pecan Crossing Dr
- 1612 Pecan Crossing Dr
- 1611 Pecan Crossing Dr
- 1608 Pecan Crossing Dr
- 1607 Pecan Crossing Dr
- 1604 Pecan Crossing Dr
- 1600 Pecan Crossing Dr
- 1603 Pecan Crossing Dr
- 1704 Pecan Crossing Dr
- 1705 Pecan Crossing Dr
- 1708 Pecan Crossing Dr
- 1712 Pecan Crossing Dr
- 1713 Pecan Crossing Dr
- 1515 Pecan Crossing Dr
- 1519 Pecan Crossing Dr
- 1511 Pecan Crossing Dr
- 1511 Hunters Ridge
- 1509 Hunters Ridge
- 1507 Hunters Ridge
- 1505 Hunters Ridge