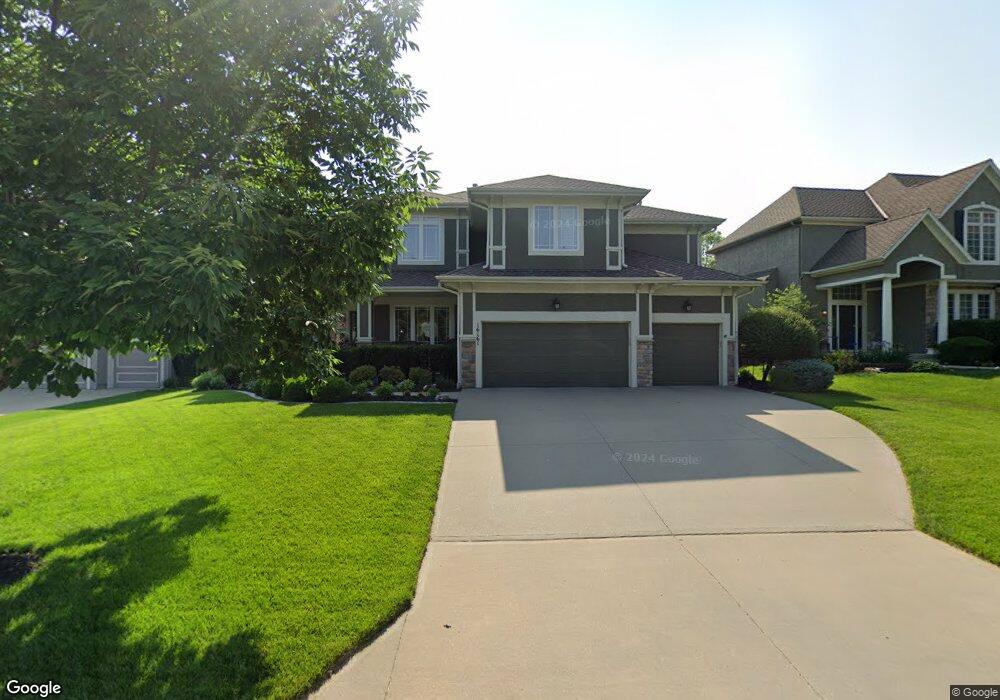
16161 S Locust St Olathe, KS 66062
Estimated Value: $621,000 - $686,000
4
Beds
4
Baths
3,316
Sq Ft
$196/Sq Ft
Est. Value
About This Home
This home is located at 16161 S Locust St, Olathe, KS 66062 and is currently estimated at $649,677, approximately $195 per square foot. 16161 S Locust St is a home located in Johnson County with nearby schools including Arbor Creek Elementary School, Chisholm Trail Middle School, and Olathe South Sr High School.
Ownership History
Date
Name
Owned For
Owner Type
Purchase Details
Closed on
Mar 24, 2005
Sold by
Stonewood Builders Llc
Bought by
Peters Tamra J and Peters Daniel W
Current Estimated Value
Home Financials for this Owner
Home Financials are based on the most recent Mortgage that was taken out on this home.
Original Mortgage
$60,950
Outstanding Balance
$45,868
Interest Rate
5.89%
Mortgage Type
Future Advance Clause Open End Mortgage
Estimated Equity
$603,809
Purchase Details
Closed on
Aug 17, 2004
Sold by
Tri Star Development Co Llc
Bought by
Stonewood Builders Llc
Home Financials for this Owner
Home Financials are based on the most recent Mortgage that was taken out on this home.
Original Mortgage
$292,200
Interest Rate
6.08%
Mortgage Type
Construction
Create a Home Valuation Report for This Property
The Home Valuation Report is an in-depth analysis detailing your home's value as well as a comparison with similar homes in the area
Home Values in the Area
Average Home Value in this Area
Purchase History
| Date | Buyer | Sale Price | Title Company |
|---|---|---|---|
| Peters Tamra J | -- | First American Title | |
| Stonewood Builders Llc | -- | Security Land Title Company |
Source: Public Records
Mortgage History
| Date | Status | Borrower | Loan Amount |
|---|---|---|---|
| Open | Peters Tamra J | $60,950 | |
| Previous Owner | Stonewood Builders Llc | $292,200 |
Source: Public Records
Tax History Compared to Growth
Tax History
| Year | Tax Paid | Tax Assessment Tax Assessment Total Assessment is a certain percentage of the fair market value that is determined by local assessors to be the total taxable value of land and additions on the property. | Land | Improvement |
|---|---|---|---|---|
| 2024 | $7,913 | $69,437 | $9,834 | $59,603 |
| 2023 | $7,605 | $65,814 | $8,934 | $56,880 |
| 2022 | $6,800 | $57,282 | $8,117 | $49,165 |
| 2021 | $6,879 | $55,396 | $8,117 | $47,279 |
| 2020 | $6,699 | $53,464 | $8,117 | $45,347 |
| 2019 | $6,574 | $52,118 | $7,833 | $44,285 |
| 2018 | $6,511 | $51,244 | $7,115 | $44,129 |
| 2017 | $6,247 | $48,668 | $6,472 | $42,196 |
| 2016 | $5,870 | $46,897 | $5,885 | $41,012 |
| 2015 | $5,611 | $44,862 | $5,885 | $38,977 |
| 2013 | -- | $40,906 | $5,885 | $35,021 |
Source: Public Records
Map
Nearby Homes
- 16211 S Locust St
- 16311 W 163rd Ct
- 15957 W 160th St
- 15227 W 161st Ct
- 15275 W 161st Ct
- 15268 W 161st Ct
- 15276 W 161st Ct
- 15260 W 161st Ct
- 15396 W 161st Ct
- 15372 W 161st Ct
- 15302 W 161st St
- 15286 W 161st St
- 15351 W 161st St
- 15383 W 161st St
- 15415 W 161st St
- 15399 W 161st St
- 15447 W 161st St
- 15431 W 161st St
- 15388 W 161st Terrace
- 15316 W 161st Terrace
- 16171 S Locust St
- 16151 S Locust St
- 16146 S Summertree Ln
- 16181 S Locust St
- 16152 S Summertree Ln
- 16144 S Summertree Ln
- 16145 S Locust St
- 16160 S Locust St
- 16150 S Locust St
- 16170 S Locust St
- 16140 S Summertree Ln
- 16182 S Summertree Ln
- 16191 S Locust St
- 16180 S Locust St
- 16141 S Locust St
- 16146 S Locust St
- 16136 S Summertree Ln
- 16140 S Locust St
- 15416 W 172nd Terrace
- 16190 S Locust St