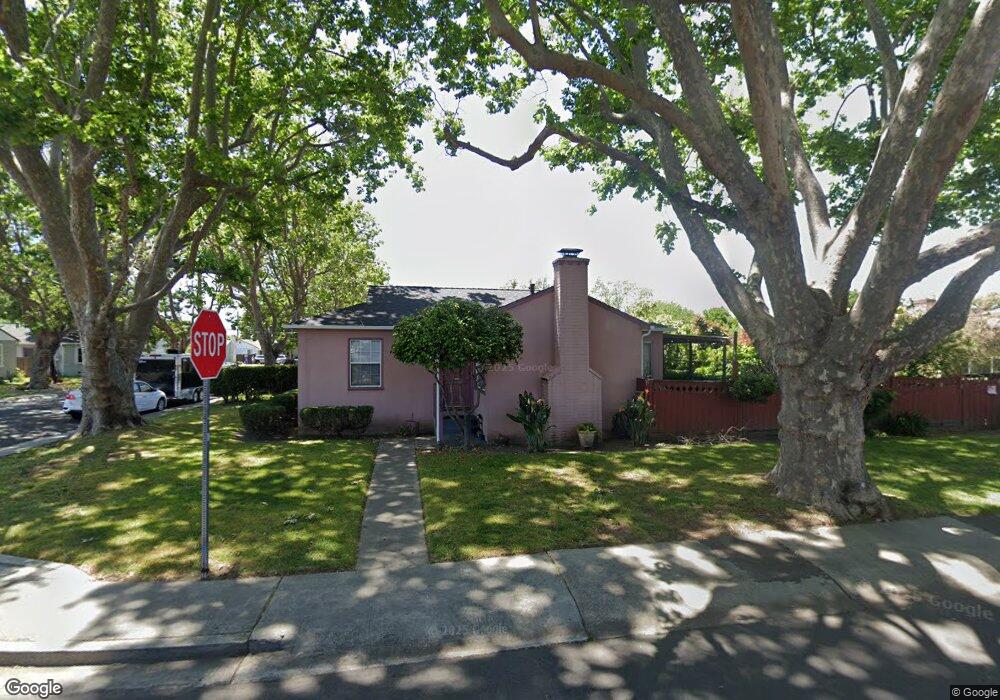
16163 Via Segundo San Lorenzo, CA 94580
Estimated Value: $716,000 - $747,000
3
Beds
1
Bath
1,000
Sq Ft
$738/Sq Ft
Est. Value
About This Home
This home is located at 16163 Via Segundo, San Lorenzo, CA 94580 and is currently estimated at $738,295, approximately $738 per square foot. 16163 Via Segundo is a home located in Alameda County with nearby schools including Lorenzo Manor Elementary School, Bohannon Middle School, and San Lorenzo High School.
Ownership History
Date
Name
Owned For
Owner Type
Purchase Details
Closed on
Jul 25, 1996
Sold by
Bertrand Marie C
Bought by
Lopez Javier and Lopez Marina E
Current Estimated Value
Home Financials for this Owner
Home Financials are based on the most recent Mortgage that was taken out on this home.
Original Mortgage
$127,650
Outstanding Balance
$10,189
Interest Rate
8.32%
Mortgage Type
FHA
Estimated Equity
$728,106
Purchase Details
Closed on
Jun 27, 1996
Sold by
Bertrand Larry Lee
Bought by
Bertrand Marie C
Home Financials for this Owner
Home Financials are based on the most recent Mortgage that was taken out on this home.
Original Mortgage
$127,650
Outstanding Balance
$10,189
Interest Rate
8.32%
Mortgage Type
FHA
Estimated Equity
$728,106
Create a Home Valuation Report for This Property
The Home Valuation Report is an in-depth analysis detailing your home's value as well as a comparison with similar homes in the area
Home Values in the Area
Average Home Value in this Area
Purchase History
| Date | Buyer | Sale Price | Title Company |
|---|---|---|---|
| Lopez Javier | $130,500 | Chicago Title Co | |
| Bertrand Marie C | -- | Chicago Title Co | |
| Bertrand Marie C | -- | Chicago Title Co | |
| Bertrand Marie C | -- | Chicago Title Co | |
| Bertrand Marie C | -- | Chicago Title Co | |
| Bertrand Marie C | -- | Chicago Title Co |
Source: Public Records
Mortgage History
| Date | Status | Borrower | Loan Amount |
|---|---|---|---|
| Open | Lopez Javier | $127,650 |
Source: Public Records
Tax History Compared to Growth
Tax History
| Year | Tax Paid | Tax Assessment Tax Assessment Total Assessment is a certain percentage of the fair market value that is determined by local assessors to be the total taxable value of land and additions on the property. | Land | Improvement |
|---|---|---|---|---|
| 2025 | $3,188 | $205,530 | $63,840 | $148,690 |
| 2024 | $3,188 | $201,364 | $62,589 | $145,775 |
| 2023 | $3,187 | $204,279 | $61,362 | $142,917 |
| 2022 | $3,124 | $193,274 | $60,159 | $140,115 |
| 2021 | $3,030 | $189,347 | $58,979 | $137,368 |
| 2020 | $2,953 | $194,335 | $58,375 | $135,960 |
| 2019 | $2,941 | $190,525 | $57,230 | $133,295 |
| 2018 | $2,728 | $186,790 | $56,108 | $130,682 |
| 2017 | $2,607 | $183,128 | $55,008 | $128,120 |
| 2016 | $2,483 | $179,538 | $53,930 | $125,608 |
| 2015 | $2,426 | $176,842 | $53,120 | $123,722 |
| 2014 | $2,389 | $173,379 | $52,080 | $121,299 |
Source: Public Records
Map
Nearby Homes
- 15958 Via Descanso
- 15867 Hesperian Blvd
- 17347 Via Encinas
- 17761 Via Arriba
- 17316 Via Flores
- 17779 Rainier Ave
- 16011 Via Conejo
- 819 Bockman Rd
- 334 Oxford St
- 19461 Royal Ave
- 17754 Meekland Ave Unit 1
- 16050 Via Olinda
- 19665 Royal Ave
- 179 Loma Verde Dr
- 19150 Hesperian Blvd Unit 19
- 181 E Lewelling Blvd
- 19539 Meekland Ave
- 769 Bartlett Ave
- 0 E 14th St Unit 41059501
- 638 Paseo Del Rio
- 321 Via Lucero
- 16155 Via Segundo
- 16162 Via Segundo
- 333 Via Lucero
- 16147 Via Segundo
- 17033 Via Segundo
- 16154 Via Segundo
- 326 Via Lucero
- 345 Via Lucero
- 281 Via Lucero
- 16139 Via Segundo
- 294 Via Lucero
- 16146 Via Segundo
- 17030 Via Anacapa
- 367 Via Lucero
- 17133 Via Segundo
- 16138 Via Segundo
- 16148 Via Primero
- 16131 Via Segundo
- 17050 Via Segundo