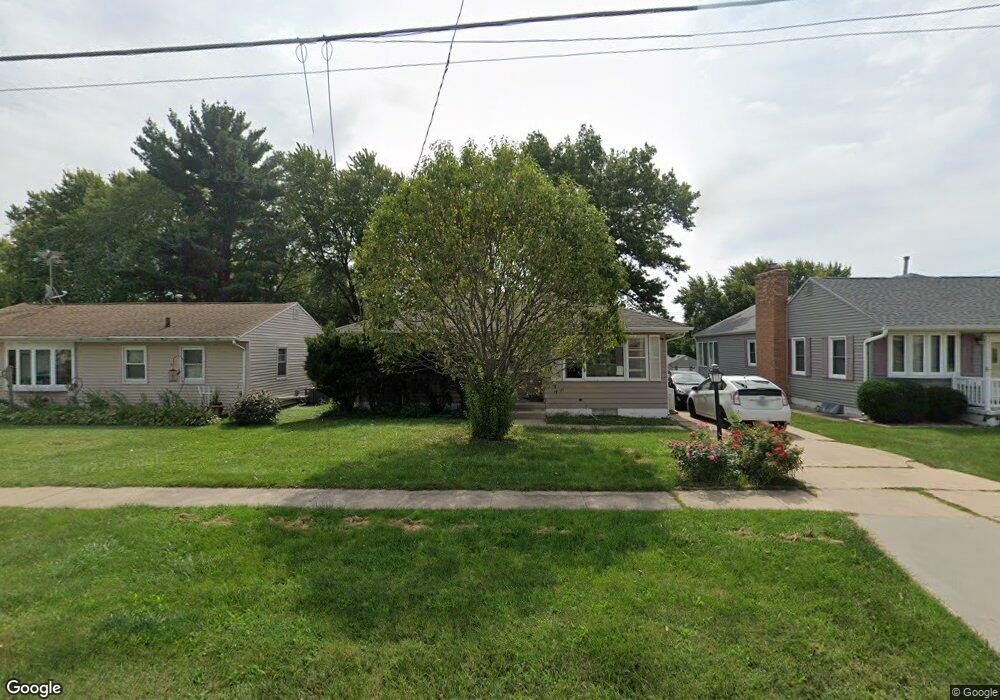
1617 Downing Ave Waterloo, IA 50701
Estimated Value: $125,000 - $134,000
2
Beds
1
Bath
918
Sq Ft
$143/Sq Ft
Est. Value
About This Home
This home is located at 1617 Downing Ave, Waterloo, IA 50701 and is currently estimated at $131,064, approximately $142 per square foot. 1617 Downing Ave is a home located in Black Hawk County with nearby schools including Becker Elementary School, Central Middle School, and West High School.
Ownership History
Date
Name
Owned For
Owner Type
Purchase Details
Closed on
Jun 21, 2016
Sold by
Abcd Real Estate Llc
Bought by
Panhwar Abdul K and Panhwar Debra K
Current Estimated Value
Home Financials for this Owner
Home Financials are based on the most recent Mortgage that was taken out on this home.
Original Mortgage
$64,800
Outstanding Balance
$29,079
Interest Rate
3.64%
Mortgage Type
New Conventional
Estimated Equity
$101,985
Purchase Details
Closed on
Oct 15, 2015
Sold by
Us Bank National Association
Bought by
Abcd Real Estate Llc
Purchase Details
Closed on
Aug 26, 2015
Sold by
Sheriff Of Black Hawk County and Dunning Daniel R
Bought by
Us Bank National Association
Purchase Details
Closed on
Jul 24, 2009
Sold by
Winter Kyle and Winter Elizabeth
Bought by
Dunning Daniel R
Home Financials for this Owner
Home Financials are based on the most recent Mortgage that was taken out on this home.
Original Mortgage
$109,971
Interest Rate
5.49%
Mortgage Type
FHA
Create a Home Valuation Report for This Property
The Home Valuation Report is an in-depth analysis detailing your home's value as well as a comparison with similar homes in the area
Home Values in the Area
Average Home Value in this Area
Purchase History
| Date | Buyer | Sale Price | Title Company |
|---|---|---|---|
| Panhwar Abdul K | $81,000 | None Available | |
| Abcd Real Estate Llc | $57,500 | None Available | |
| Us Bank National Association | $58,000 | None Available | |
| Dunning Daniel R | $112,000 | None Available |
Source: Public Records
Mortgage History
| Date | Status | Borrower | Loan Amount |
|---|---|---|---|
| Open | Panhwar Abdul K | $64,800 | |
| Previous Owner | Dunning Daniel R | $109,971 | |
| Closed | Us Bank National Association | $0 |
Source: Public Records
Tax History Compared to Growth
Tax History
| Year | Tax Paid | Tax Assessment Tax Assessment Total Assessment is a certain percentage of the fair market value that is determined by local assessors to be the total taxable value of land and additions on the property. | Land | Improvement |
|---|---|---|---|---|
| 2024 | $1,946 | $97,320 | $19,890 | $77,430 |
| 2023 | $1,860 | $97,320 | $19,890 | $77,430 |
| 2022 | $1,810 | $84,690 | $19,890 | $64,800 |
| 2021 | $1,848 | $84,690 | $19,890 | $64,800 |
| 2020 | $1,820 | $81,630 | $16,830 | $64,800 |
| 2019 | $1,820 | $81,630 | $16,830 | $64,800 |
| 2018 | $1,820 | $81,630 | $16,830 | $64,800 |
| 2017 | $1,800 | $81,630 | $16,830 | $64,800 |
| 2016 | $1,952 | $78,390 | $16,830 | $61,560 |
| 2015 | $1,952 | $94,730 | $16,830 | $77,900 |
| 2014 | $1,990 | $94,730 | $16,830 | $77,900 |
Source: Public Records
Map
Nearby Homes
- 1240 Eleanor Dr
- 1225 Downing Ave
- 1221 Downing Ave
- 1711 Huntington Rd
- 1269 Scott Ave
- 1290 Scott Ave
- 1248 Scott Ave
- 1325 Huntington Rd
- 1268 Saint Andrews Ave
- 1200 St Andrews Ave
- 2320 University Ave
- 1018 Janney Ave
- 1311 Magnolia Pkwy
- 725 Harwood Ave
- 1308 Wallgate Ave
- 104 Bergen Dr
- 102 Bergen Dr
- 437 Ardmore St
- 432 Auburn St
- 323 Hartman Ave
- 1621 Downing Ave
- 1611 Downing Ave
- 1607 Downing Ave
- 1625 Downing Ave
- 1601 Downing Ave
- 1523 Downing Ave
- 1266 Doreen Ave
- 1517 Downing Ave
- 1260 Doreen Ave
- 1231 Downing Ct Unit 1297
- 1511 Downing Ave
- 1254 Doreen Ave
- 1135 Wren Rd
- 1703 Downing Ave
- 1248 Doreen Ave
- 1507 Downing Ave
- 1141 Wren Rd
- 1504 Downing Ave
- 1709 Downing Ave
- 1242 Doreen Ave