1617 E 20th St Oakland, CA 94606
San Antonio NeighborhoodEstimated Value: $605,687 - $706,000
3
Beds
2
Baths
2,154
Sq Ft
$305/Sq Ft
Est. Value
About This Home
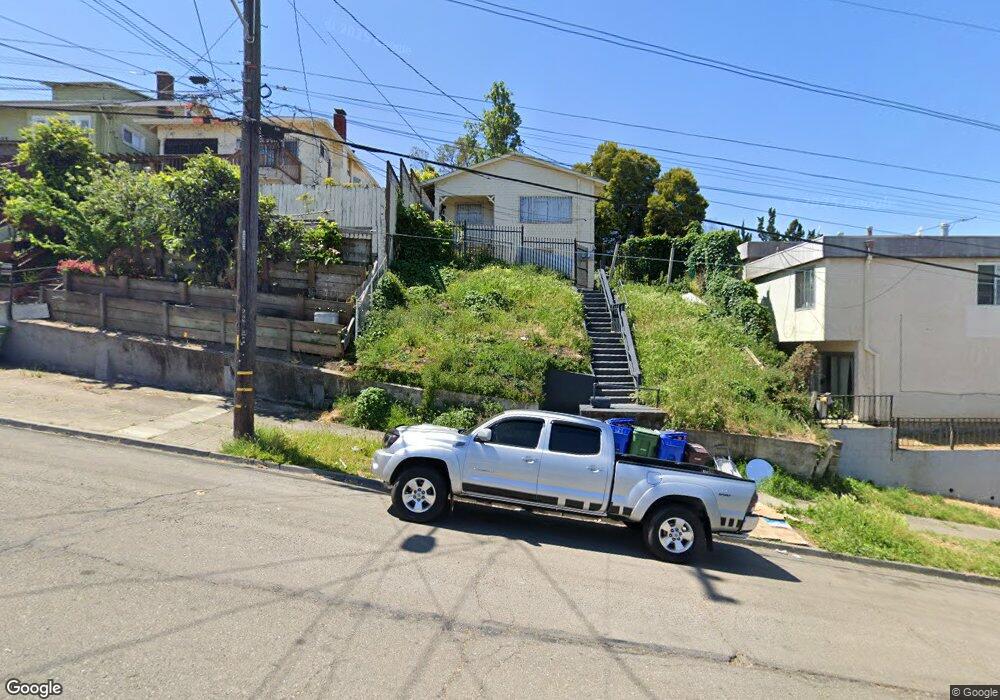
This home is located at 1617 E 20th St, Oakland, CA 94606 and is currently estimated at $657,672, approximately $305 per square foot. 1617 E 20th St is a home located in Alameda County with nearby schools including Garfield Elementary School, Roosevelt Middle School, and Oakland High School.
Ownership History
Date
Name
Owned For
Owner Type
Purchase Details
Closed on
Dec 18, 2023
Sold by
David Lam Gift Trust and Deborah Lam Gift Trust
Bought by
1617 East 20Th Llc
Current Estimated Value
Purchase Details
Closed on
Feb 4, 2021
Sold by
Lam Janet Wo Wan
Bought by
Lam Family Trust and Lam
Purchase Details
Closed on
Jan 28, 2021
Sold by
Lam Family Trust and Lam Randy
Bought by
David Lam Gift Trust and Diana L Lam Gift Trust
Purchase Details
Closed on
Apr 21, 2015
Sold by
Lam Randy and Lam Janet
Bought by
The Lam Family Trust
Purchase Details
Closed on
Jan 24, 1995
Sold by
Lam Shing Ping
Bought by
Lam Randy Shing Fong and Lam Janet Wo Wan
Create a Home Valuation Report for This Property
The Home Valuation Report is an in-depth analysis detailing your home's value as well as a comparison with similar homes in the area
Home Values in the Area
Average Home Value in this Area
Purchase History
| Date | Buyer | Sale Price | Title Company |
|---|---|---|---|
| 1617 East 20Th Llc | -- | None Listed On Document | |
| Lam Family Trust | -- | -- | |
| David Lam Gift Trust | -- | None Listed On Document | |
| David Lam Gift Trust | -- | None Listed On Document | |
| Survivors Trust | -- | None Listed On Document | |
| The Lam Family Trust | -- | None Available | |
| Lam Randy Shing Fong | -- | -- |
Source: Public Records
Tax History
| Year | Tax Paid | Tax Assessment Tax Assessment Total Assessment is a certain percentage of the fair market value that is determined by local assessors to be the total taxable value of land and additions on the property. | Land | Improvement |
|---|---|---|---|---|
| 2025 | $5,060 | $213,041 | $33,256 | $179,785 |
| 2024 | $5,060 | $208,865 | $32,604 | $176,261 |
| 2023 | $5,162 | $204,770 | $31,965 | $172,805 |
| 2022 | $4,892 | $200,756 | $31,338 | $169,418 |
| 2021 | $4,486 | $196,820 | $30,724 | $166,096 |
| 2020 | $4,431 | $194,802 | $30,409 | $164,393 |
| 2019 | $4,142 | $190,983 | $29,812 | $161,171 |
| 2018 | $4,056 | $187,240 | $29,228 | $158,012 |
| 2017 | $3,852 | $183,569 | $28,655 | $154,914 |
| 2016 | $3,656 | $179,970 | $28,093 | $151,877 |
| 2015 | $3,630 | $177,268 | $27,671 | $149,597 |
| 2014 | $3,621 | $173,796 | $27,129 | $146,667 |
Source: Public Records
Map
Nearby Homes
- 1641 E 20th St
- 1736 E 21st St
- 1839 Commerce Way
- 1739 E 22nd St
- 1747 E 22nd St
- 2212 17th Ave
- 1737 13th Ave
- 2138 19th Ave
- 2036 E 20th St
- 1140 E 22nd St
- 1533 14th Ave
- 1418 15th Ave
- 1515 14th Ave Unit 302
- 1515 14th Ave Unit 305
- 2301 12th Ave
- 1504 13th Ave
- 1925 E 15th St
- 2134 E 21st St
- 2207 E 21st St
- 2116 International Blvd
Your Personal Tour Guide
Ask me questions while you tour the home.