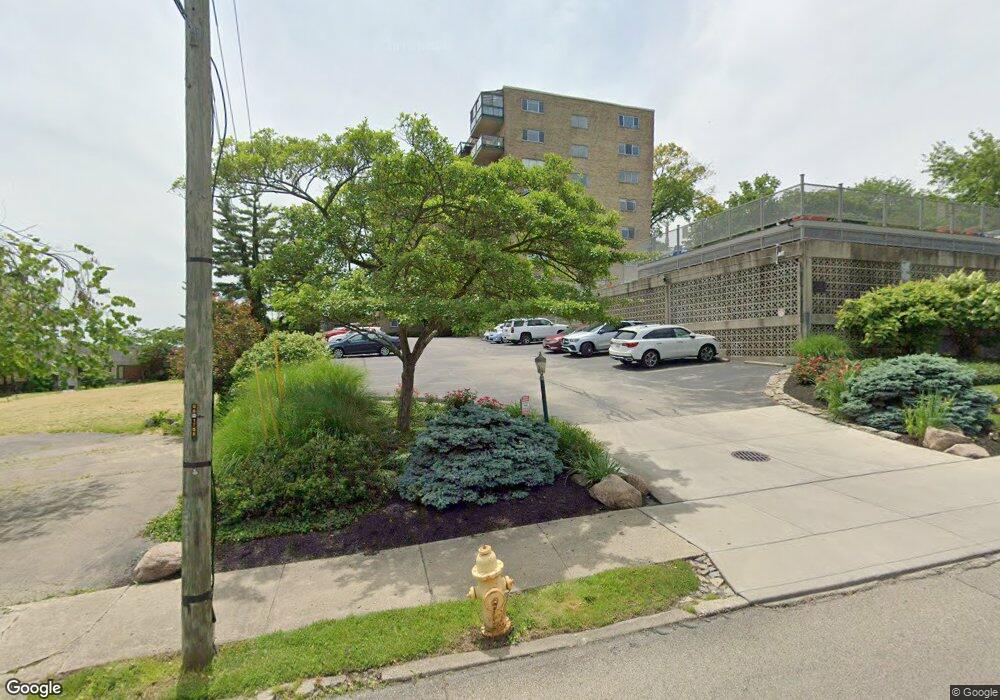
1617 E Mcmillan St Cincinnati, OH 45206
East Walnut Hills NeighborhoodEstimated Value: $123,000 - $150,000
1
Bed
1
Bath
831
Sq Ft
$165/Sq Ft
Est. Value
About This Home
This home is located at 1617 E Mcmillan St, Cincinnati, OH 45206 and is currently estimated at $137,441, approximately $165 per square foot. 1617 E Mcmillan St is a home located in Hamilton County with nearby schools including Frederick Douglass Elementary School, Clark Montessori High School, and Robert A. Taft Information Technology High School.
Ownership History
Date
Name
Owned For
Owner Type
Purchase Details
Closed on
Jul 21, 2023
Sold by
Clayburn Wanda
Bought by
Charles W Broeman Ii Revocable Trust and Broeman
Current Estimated Value
Purchase Details
Closed on
Aug 23, 2017
Sold by
Duvall Roger L and Duvall Mary Jo
Bought by
Clayburn Wanda
Home Financials for this Owner
Home Financials are based on the most recent Mortgage that was taken out on this home.
Original Mortgage
$80,275
Interest Rate
3.96%
Mortgage Type
New Conventional
Purchase Details
Closed on
Aug 21, 2013
Sold by
Ewers Jerome S
Bought by
Duvall Roger L and Duvall Mary Jo
Purchase Details
Closed on
Oct 3, 2001
Sold by
Byer Heather Rae
Bought by
Ewers Jerome S
Purchase Details
Closed on
Jul 28, 1999
Sold by
Arington Laura
Bought by
Byer Heather Rae
Create a Home Valuation Report for This Property
The Home Valuation Report is an in-depth analysis detailing your home's value as well as a comparison with similar homes in the area
Home Values in the Area
Average Home Value in this Area
Purchase History
| Date | Buyer | Sale Price | Title Company |
|---|---|---|---|
| Charles W Broeman Ii Revocable Trust | $115,000 | Chicago Title Company | |
| Clayburn Wanda | $84,500 | None Available | |
| Duvall Roger L | $68,500 | Attorney | |
| Ewers Jerome S | $50,000 | -- | |
| Byer Heather Rae | $48,000 | -- |
Source: Public Records
Mortgage History
| Date | Status | Borrower | Loan Amount |
|---|---|---|---|
| Previous Owner | Clayburn Wanda | $80,275 |
Source: Public Records
Tax History
| Year | Tax Paid | Tax Assessment Tax Assessment Total Assessment is a certain percentage of the fair market value that is determined by local assessors to be the total taxable value of land and additions on the property. | Land | Improvement |
|---|---|---|---|---|
| 2025 | $2,946 | $47,919 | $12,250 | $35,669 |
| 2023 | $2,921 | $47,919 | $12,250 | $35,669 |
| 2022 | $2,010 | $29,575 | $6,825 | $22,750 |
| 2021 | $1,936 | $29,575 | $6,825 | $22,750 |
| 2020 | $1,993 | $29,575 | $6,825 | $22,750 |
| 2019 | $2,033 | $27,598 | $6,825 | $20,773 |
| 2018 | $2,036 | $27,598 | $6,825 | $20,773 |
| 2017 | $1,935 | $27,598 | $6,825 | $20,773 |
| 2016 | $1,705 | $23,976 | $6,850 | $17,126 |
| 2015 | $1,537 | $23,976 | $6,850 | $17,126 |
| 2014 | $1,548 | $23,976 | $6,850 | $17,126 |
| 2013 | $1,375 | $19,950 | $7,210 | $12,740 |
Source: Public Records
Map
Nearby Homes
- 2530 Hackberry St
- 2548 Hackberry St
- 2603 Moorman Ave
- 1532 William Howard Taft Rd
- 1520 William Howard Taft Rd
- 2617 Hackberry St
- 2625 Cleinview Ave
- 1635 Clayton St
- 1637 Clayton St
- 1382 Burdette Ave
- 2717 Johnstone Place
- 2207 Riverside Dr
- 2734 Cleinview Ave
- 1932 Riverside Dr
- 1924 Riverside Dr
- 1922 Riverside Dr
- 1815 William Howard Taft Rd
- 2235 Riverside Dr
- 2260 Riverside Dr
- 0 Ashland Ave
- 1617 E Mcmillan St Unit 804
- 1617 E Mcmillan St Unit 805
- 1617 E Mcmillan St
- 1617 E Mcmillan St Unit 803
- 1617 E Mcmillan St
- 1617 E Mcmillan St
- 1617 E Mcmillan St
- 1617 E Mcmillan St Unit 501
- 1617 E Mcmillan St Unit 705
- 1617 E Mcmillan St Unit 704
- 1617 E Mcmillan St
- 1617 E Mcmillan St
- 1617 E Mcmillan St
- 1617 E Mcmillan St
- 1617 E Mcmillan St
- 1617 E Mcmillan St
- 1617 E Mcmillan St
- 1617 E Mcmillan St
- 1617 E Mcmillan St Unit 306
- 1617 E Mcmillan St
Your Personal Tour Guide
Ask me questions while you tour the home.