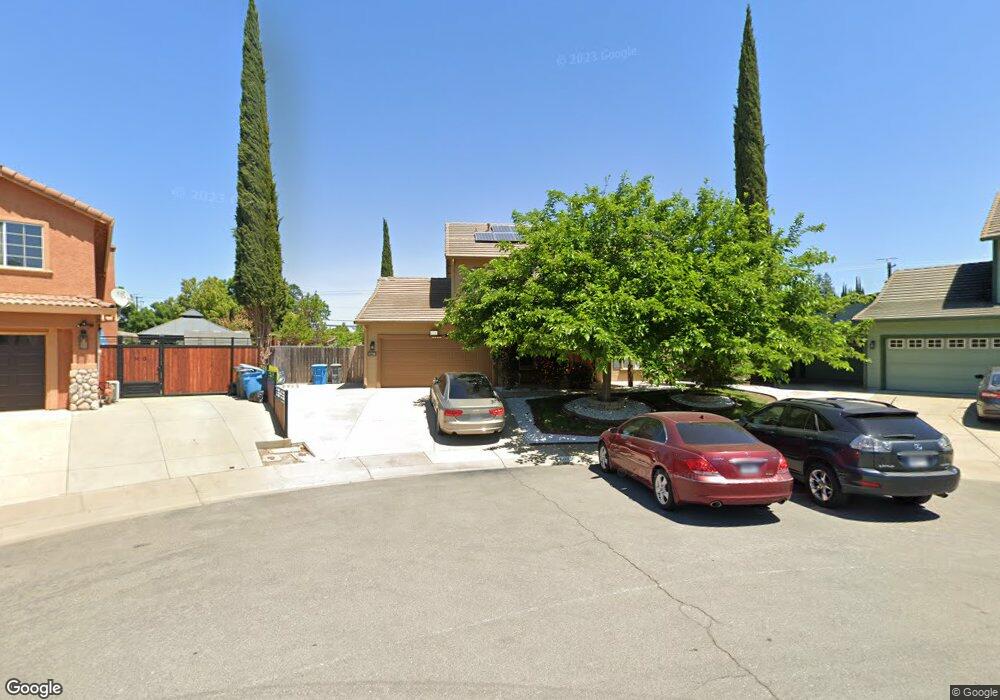
1617 Lancaster Ct Yuba City, CA 95993
Estimated Value: $453,000 - $516,000
5
Beds
3
Baths
2,299
Sq Ft
$215/Sq Ft
Est. Value
About This Home
This home is located at 1617 Lancaster Ct, Yuba City, CA 95993 and is currently estimated at $493,288, approximately $214 per square foot. 1617 Lancaster Ct is a home located in Sutter County with nearby schools including Lincoln Elementary School, Yuba City High School, and St. Isidore Catholic School.
Ownership History
Date
Name
Owned For
Owner Type
Purchase Details
Closed on
Sep 12, 2013
Sold by
Singh Manjit and Singh Jasvir
Bought by
Singh Jasvir and Pannu Devinder
Current Estimated Value
Purchase Details
Closed on
Jul 22, 2003
Sold by
Kaur Harbans and Singh Manjit
Bought by
Singh Manjit and Singh Jasvir
Home Financials for this Owner
Home Financials are based on the most recent Mortgage that was taken out on this home.
Original Mortgage
$90,000
Interest Rate
5.15%
Mortgage Type
Purchase Money Mortgage
Purchase Details
Closed on
Apr 9, 2001
Sold by
Kaur Baljeet
Bought by
Singh Manjit
Home Financials for this Owner
Home Financials are based on the most recent Mortgage that was taken out on this home.
Original Mortgage
$97,000
Interest Rate
7.09%
Create a Home Valuation Report for This Property
The Home Valuation Report is an in-depth analysis detailing your home's value as well as a comparison with similar homes in the area
Home Values in the Area
Average Home Value in this Area
Purchase History
| Date | Buyer | Sale Price | Title Company |
|---|---|---|---|
| Singh Jasvir | -- | None Available | |
| Singh Manjit | -- | Placer Title Company | |
| Singh Manjit | -- | Placer Title Company |
Source: Public Records
Mortgage History
| Date | Status | Borrower | Loan Amount |
|---|---|---|---|
| Closed | Singh Manjit | $90,000 | |
| Closed | Singh Manjit | $97,000 |
Source: Public Records
Tax History Compared to Growth
Tax History
| Year | Tax Paid | Tax Assessment Tax Assessment Total Assessment is a certain percentage of the fair market value that is determined by local assessors to be the total taxable value of land and additions on the property. | Land | Improvement |
|---|---|---|---|---|
| 2025 | $3,335 | $240,475 | $49,957 | $190,518 |
| 2024 | $3,335 | $235,761 | $48,978 | $186,783 |
| 2023 | $3,335 | $231,139 | $48,018 | $183,121 |
| 2022 | $3,231 | $226,608 | $47,077 | $179,531 |
| 2021 | $3,189 | $222,193 | $46,170 | $176,023 |
| 2020 | $3,151 | $219,917 | $45,698 | $174,219 |
| 2019 | $3,098 | $215,605 | $44,802 | $170,803 |
| 2018 | $3,038 | $211,377 | $43,923 | $167,454 |
| 2017 | $2,975 | $207,232 | $43,063 | $164,169 |
| 2016 | $2,929 | $203,169 | $42,218 | $160,951 |
| 2015 | $2,908 | $200,116 | $41,583 | $158,533 |
| 2014 | $2,867 | $196,197 | $40,769 | $155,428 |
Source: Public Records
Map
Nearby Homes
- 1150 Pico Ct
- 1181 Robert Dr
- 1018 Petty Ct
- 1372 Johnathan Dr
- 1781 Harbor Town Dr
- 1105 Johnathan Dr
- 1524 Spyglass Dr
- 872 Mesa Verde
- 1474 Smith Rd
- 1515 Jodi Dr
- 2038 Nicholas Dr
- 2057 Nicholas Dr
- 0 Victoria Ct
- 1180 Sanborn Rd
- 1811 Alyssa Dr
- 2021 Nand Dr
- 1981 Ash Ct
- 1525 Bogue Rd
- 1255 Lincoln Rd Unit 29
- 1358 Starlite Ln
- 1629 Lancaster Ct
- 1524 Sessler Dr
- 1614 Lancaster Ct
- 1506 Sessler Dr
- 1624 Lancaster Ct
- 1304 S Walton Ave
- 1290 S Walton Ave
- 1316 S Walton Ave
- 1638 Lancaster Ct
- 1630 Lancaster Ct
- 1276 S Walton Ave
- 1330 S Walton Ave
- 1484 Sessler Dr
- 1553 Sessler Dr
- 1521 Sessler Dr
- 1619 Tracy Dr
- 1635 Tracy Dr
- 1585 Sessler Dr
- 1262 S Walton Ave
- 1342 S Walton Ave