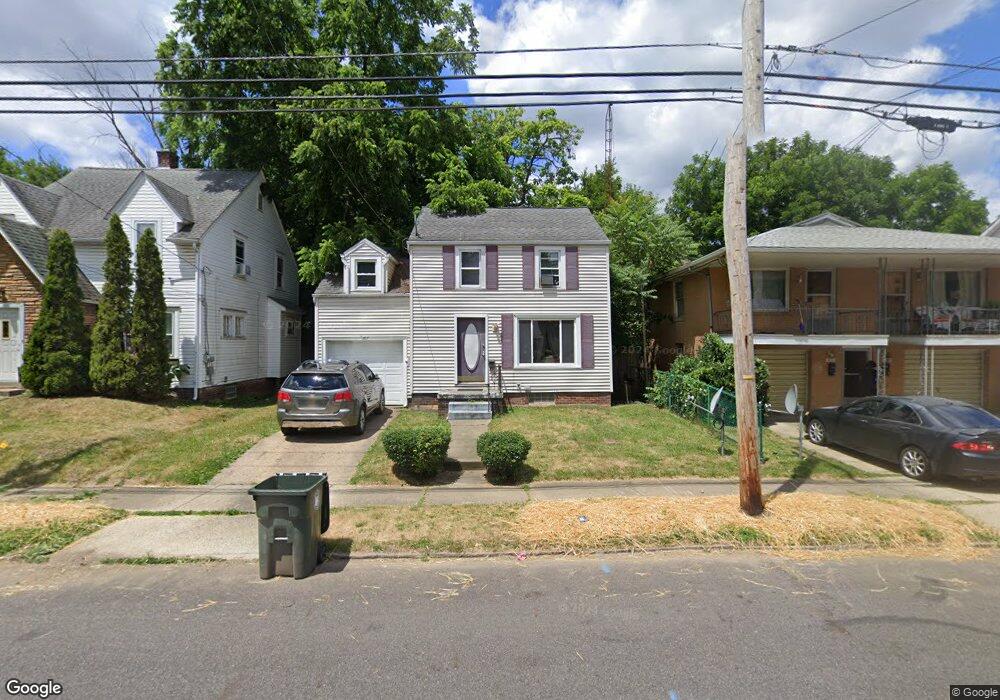
1617 Spring Ave NE Canton, OH 44714
Gibbs Area NeighborhoodEstimated Value: $73,557 - $121,000
3
Beds
1
Bath
1,068
Sq Ft
$82/Sq Ft
Est. Value
About This Home
This home is located at 1617 Spring Ave NE, Canton, OH 44714 and is currently estimated at $87,889, approximately $82 per square foot. 1617 Spring Ave NE is a home located in Stark County with nearby schools including Early Learning Center @ Schreiber, Gibbs Elementary School, and Youtz Intermediate School.
Ownership History
Date
Name
Owned For
Owner Type
Purchase Details
Closed on
Aug 1, 2011
Sold by
Ceroli Shawna R
Bought by
Akp Properties Llc
Current Estimated Value
Purchase Details
Closed on
Jun 14, 2005
Sold by
White Christine and White John
Bought by
Ceroli Shawna R
Home Financials for this Owner
Home Financials are based on the most recent Mortgage that was taken out on this home.
Original Mortgage
$57,600
Interest Rate
5.62%
Mortgage Type
Fannie Mae Freddie Mac
Purchase Details
Closed on
Mar 11, 2004
Sold by
U S Bank Na
Bought by
White Christine
Purchase Details
Closed on
Dec 31, 2003
Sold by
Solomon Eddie G and Solomon Bertha N
Bought by
U S Bank Na and Eqcc Home Equity Loan Trust 1999-1
Purchase Details
Closed on
Mar 5, 1996
Sold by
Maley William C
Bought by
Solomon Eddie G and Solomon Bertha
Home Financials for this Owner
Home Financials are based on the most recent Mortgage that was taken out on this home.
Original Mortgage
$38,712
Interest Rate
7.07%
Mortgage Type
New Conventional
Create a Home Valuation Report for This Property
The Home Valuation Report is an in-depth analysis detailing your home's value as well as a comparison with similar homes in the area
Home Values in the Area
Average Home Value in this Area
Purchase History
| Date | Buyer | Sale Price | Title Company |
|---|---|---|---|
| Akp Properties Llc | $25,000 | None Available | |
| Ceroli Shawna R | $72,000 | Sherman Title Agency Inc | |
| White Christine | $31,000 | -- | |
| U S Bank Na | $32,000 | -- | |
| Solomon Eddie G | $45,000 | -- |
Source: Public Records
Mortgage History
| Date | Status | Borrower | Loan Amount |
|---|---|---|---|
| Previous Owner | Ceroli Shawna R | $57,600 | |
| Previous Owner | Solomon Eddie G | $38,712 | |
| Closed | Ceroli Shawna R | $14,400 |
Source: Public Records
Tax History Compared to Growth
Tax History
| Year | Tax Paid | Tax Assessment Tax Assessment Total Assessment is a certain percentage of the fair market value that is determined by local assessors to be the total taxable value of land and additions on the property. | Land | Improvement |
|---|---|---|---|---|
| 2025 | -- | $24,010 | $2,590 | $21,420 |
| 2024 | -- | $24,010 | $2,590 | $21,420 |
| 2023 | $761 | $12,500 | $2,630 | $9,870 |
| 2022 | $739 | $12,500 | $2,630 | $9,870 |
| 2021 | $747 | $12,500 | $2,630 | $9,870 |
| 2020 | $661 | $9,910 | $2,140 | $7,770 |
| 2019 | $579 | $9,910 | $2,140 | $7,770 |
| 2018 | $583 | $9,910 | $2,140 | $7,770 |
| 2017 | $554 | $8,480 | $4,380 | $4,100 |
| 2016 | $555 | $8,480 | $4,380 | $4,100 |
| 2015 | $559 | $8,480 | $4,380 | $4,100 |
| 2014 | $614 | $8,760 | $4,520 | $4,240 |
| 2013 | $297 | $8,760 | $4,520 | $4,240 |
Source: Public Records
Map
Nearby Homes
- 802 17th St NE
- 1540 Miami Ct NE
- 1454 Spring Ave NE
- 211 15th St NE
- 1625 Market Ave N
- 1521 Gibbs Ave NE
- 120 16th St NW
- 1422 Plain Ave NE
- 918 19th St NE
- 1126 18th St NE
- 1412 Miami Ct NE
- 1611 Rowland Ave NE
- 1219 17th St NE
- 1421 Market Ave N
- 1332 Spring Ave NE
- 1631 Shriver Ave NE
- 1732 Harvard Ave NW
- 1734 Rowland Ave NE
- 1447 Shriver Ave NE
- 206 21st St NW
- 1621 Spring Ave NE
- 1613 Spring Ave NE
- 1627 Spring Ave NE
- 1616 Esther Ave NE
- 1607 Spring Ave NE
- 1612 Esther Ave NE
- 1620 Esther Ave NE
- 1626 Esther Ave NE
- 1629 Spring Ave NE
- 1603 Spring Ave NE
- 1630 Esther Ave NE
- 1618 Spring Ave NE
- 1608 Spring Ave NE
- 605 16th St NE
- 1612 Spring Ave NE
- 1622 Spring Ave NE
- 1626 Spring Ave NE
- 1634 Esther Ave NE
- 1602 Spring Ave NE
- 1630 Spring Ave NE