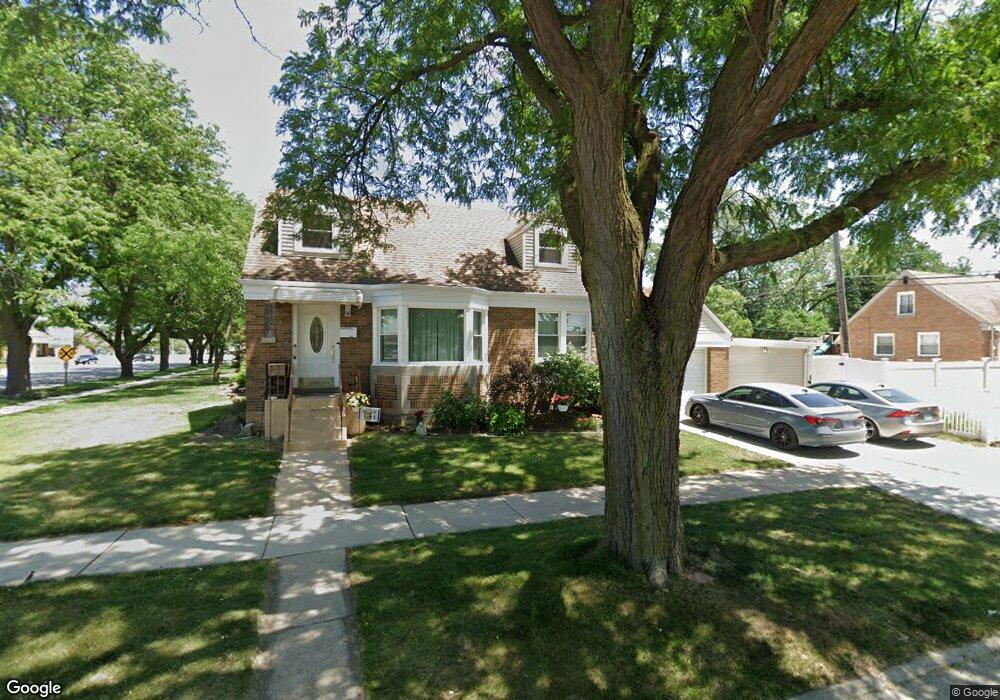
1617 Spruce Ave Des Plaines, IL 60018
Estimated Value: $357,000 - $402,000
4
Beds
2
Baths
969
Sq Ft
$388/Sq Ft
Est. Value
About This Home
This home is located at 1617 Spruce Ave, Des Plaines, IL 60018 and is currently estimated at $376,212, approximately $388 per square foot. 1617 Spruce Ave is a home located in Cook County with nearby schools including South Elementary School, Algonquin Middle School, and Maine West High School.
Ownership History
Date
Name
Owned For
Owner Type
Purchase Details
Closed on
Oct 30, 2025
Sold by
Rodriguez Land Trust and Rodriguez Pablo
Bought by
Rodriguez Pablo and Rodriguez Shannon Omalley
Current Estimated Value
Purchase Details
Closed on
Oct 6, 2022
Sold by
Rodriguez Pablo and Shannon Omalley
Bought by
Rodriguez Land Trust
Purchase Details
Closed on
Jul 25, 2016
Sold by
Rodriguez Shannon O Msllry
Bought by
Malley Rodriguez Pablo and Malley Rodriguez Shannon O
Purchase Details
Closed on
Feb 24, 2011
Sold by
Omalley Michael D and Omalley Joan A
Bought by
Omalley Michael D and Omalley Joan A
Purchase Details
Closed on
Apr 5, 2004
Sold by
Rumpf Kathleen
Bought by
Omalley Michael D and Omalley Joan A
Home Financials for this Owner
Home Financials are based on the most recent Mortgage that was taken out on this home.
Original Mortgage
$190,000
Interest Rate
5.48%
Mortgage Type
Unknown
Purchase Details
Closed on
May 23, 2002
Sold by
Meinke Eleanor F
Bought by
Meinke Eleanor F and Eleanor F Meinke Living Trust
Create a Home Valuation Report for This Property
The Home Valuation Report is an in-depth analysis detailing your home's value as well as a comparison with similar homes in the area
Home Values in the Area
Average Home Value in this Area
Purchase History
| Date | Buyer | Sale Price | Title Company |
|---|---|---|---|
| Rodriguez Pablo | -- | None Listed On Document | |
| Rodriguez Land Trust | -- | None Listed On Document | |
| Malley Rodriguez Pablo | -- | None Available | |
| Omalley Michael D | -- | None Available | |
| Omalley Michael D | $290,000 | Agtf Inc | |
| Meinke Eleanor F | -- | -- |
Source: Public Records
Mortgage History
| Date | Status | Borrower | Loan Amount |
|---|---|---|---|
| Previous Owner | Omalley Michael D | $190,000 | |
| Closed | Omalley Michael D | $75,000 |
Source: Public Records
Tax History
| Year | Tax Paid | Tax Assessment Tax Assessment Total Assessment is a certain percentage of the fair market value that is determined by local assessors to be the total taxable value of land and additions on the property. | Land | Improvement |
|---|---|---|---|---|
| 2025 | $7,646 | $30,000 | $6,135 | $23,865 |
| 2024 | $7,646 | $29,000 | $5,215 | $23,785 |
| 2023 | $7,462 | $29,000 | $5,215 | $23,785 |
| 2022 | $7,462 | $29,000 | $5,215 | $23,785 |
| 2021 | $4,677 | $15,216 | $4,294 | $10,922 |
| 2020 | $4,598 | $15,216 | $4,294 | $10,922 |
| 2019 | $4,601 | $17,097 | $4,294 | $12,803 |
| 2018 | $6,202 | $20,737 | $3,681 | $17,056 |
| 2017 | $6,092 | $20,737 | $3,681 | $17,056 |
| 2016 | $5,762 | $20,737 | $3,681 | $17,056 |
| 2015 | $5,710 | $23,384 | $3,220 | $20,164 |
| 2014 | $5,324 | $17,989 | $3,220 | $14,769 |
| 2013 | $3,890 | $17,989 | $3,220 | $14,769 |
Source: Public Records
Map
Nearby Homes
- 1080 Bogart St
- 1696 S Elm St
- 1689 S Elm St
- 1645 Illinois St
- 1445 Everett Ave
- 815 E Oakton St Unit 311
- 1394 Carol Ln
- 1754 E Lincoln Ave
- 1700 E Forest Ave
- 1721 Prospect Ave
- 1370 Fargo Ave Unit E
- 1048 E Walnut Ave
- 664 E Oakton St
- 2220 S Chestnut St
- 1561 E Walnut Ave
- 1640 S River Rd
- 1162 W Grant Dr
- 1380 Oakwood Ave Unit 306
- 1630 Henry Ave
- 635 Birchwood Ave
Your Personal Tour Guide
Ask me questions while you tour the home.