Estimated Value: $203,000 - $214,189
3
Beds
2
Baths
1,308
Sq Ft
$161/Sq Ft
Est. Value
About This Home
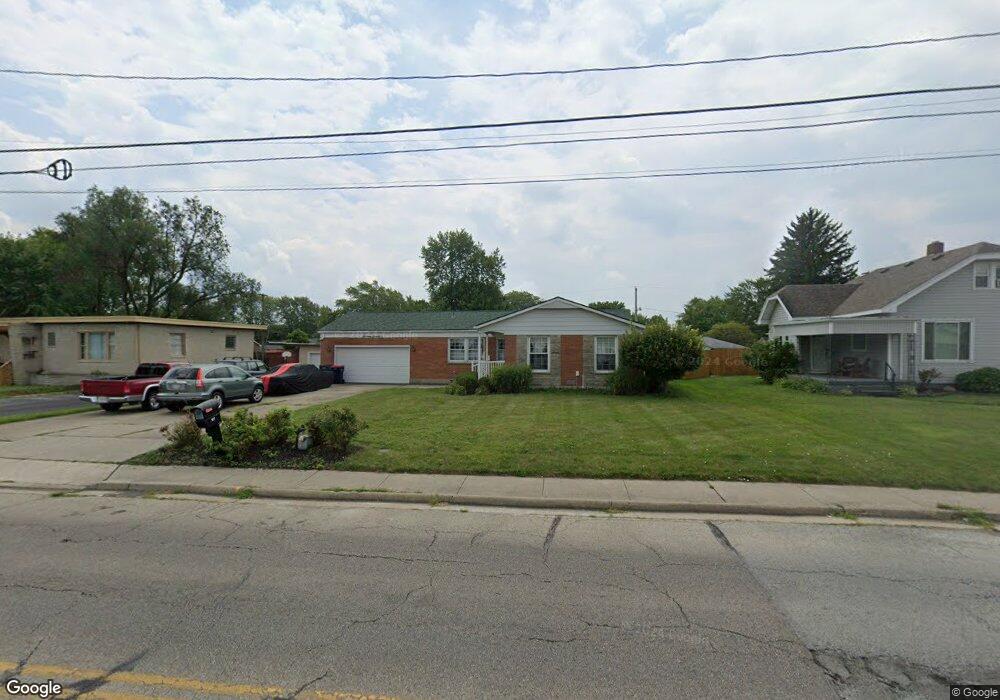
This home is located at 1617 W High St, Piqua, OH 45356 and is currently estimated at $210,547, approximately $160 per square foot. 1617 W High St is a home located in Miami County with nearby schools including Washington Primary School, Piqua Junior High School, and Piqua High School.
Ownership History
Date
Name
Owned For
Owner Type
Purchase Details
Closed on
Jun 13, 2017
Sold by
Foster William A and Foster Carole A
Bought by
Braden Anna and Brock Matthew
Current Estimated Value
Purchase Details
Closed on
Feb 1, 2001
Sold by
Oakes Lou Ellen
Bought by
Smith Douglas and Smith Susan
Home Financials for this Owner
Home Financials are based on the most recent Mortgage that was taken out on this home.
Original Mortgage
$90,400
Interest Rate
7.22%
Mortgage Type
New Conventional
Purchase Details
Closed on
Jul 1, 1987
Bought by
Oakes Lou Ellen
Create a Home Valuation Report for This Property
The Home Valuation Report is an in-depth analysis detailing your home's value as well as a comparison with similar homes in the area
Home Values in the Area
Average Home Value in this Area
Purchase History
| Date | Buyer | Sale Price | Title Company |
|---|---|---|---|
| Braden Anna | $100,000 | None Available | |
| Smith Douglas | $113,000 | -- | |
| Oakes Lou Ellen | $62,000 | -- |
Source: Public Records
Mortgage History
| Date | Status | Borrower | Loan Amount |
|---|---|---|---|
| Previous Owner | Smith Douglas | $90,400 |
Source: Public Records
Tax History Compared to Growth
Tax History
| Year | Tax Paid | Tax Assessment Tax Assessment Total Assessment is a certain percentage of the fair market value that is determined by local assessors to be the total taxable value of land and additions on the property. | Land | Improvement |
|---|---|---|---|---|
| 2024 | $1,611 | $49,010 | $11,870 | $37,140 |
| 2023 | $1,611 | $49,010 | $11,870 | $37,140 |
| 2022 | $2,049 | $49,010 | $11,870 | $37,140 |
| 2021 | $1,660 | $36,300 | $8,790 | $27,510 |
| 2020 | $1,626 | $36,300 | $8,790 | $27,510 |
| 2019 | $1,635 | $36,300 | $8,790 | $27,510 |
| 2018 | $1,605 | $34,030 | $8,790 | $25,240 |
| 2017 | $1,625 | $34,030 | $8,790 | $25,240 |
| 2016 | $1,607 | $34,030 | $8,790 | $25,240 |
| 2015 | $1,645 | $34,030 | $8,790 | $25,240 |
| 2014 | $1,645 | $34,030 | $8,790 | $25,240 |
| 2013 | $1,650 | $34,030 | $8,790 | $25,240 |
Source: Public Records
Map
Nearby Homes