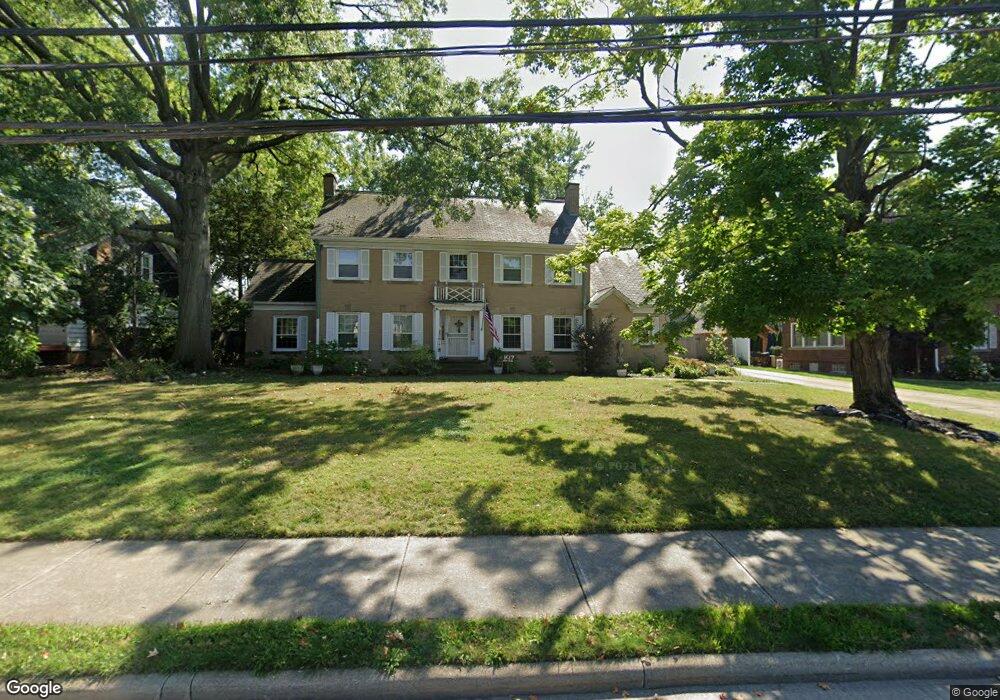
1617 W Schaaf Rd Cleveland, OH 44109
Old Brooklyn NeighborhoodEstimated Value: $259,000 - $425,000
5
Beds
3
Baths
3,443
Sq Ft
$102/Sq Ft
Est. Value
About This Home
This home is located at 1617 W Schaaf Rd, Cleveland, OH 44109 and is currently estimated at $351,923, approximately $102 per square foot. 1617 W Schaaf Rd is a home located in Cuyahoga County with nearby schools including Benjamin Franklin, Almira Academy, and Artemus Ward School.
Ownership History
Date
Name
Owned For
Owner Type
Purchase Details
Closed on
Jun 28, 2008
Sold by
Skufca Matthew R
Bought by
Kolodny John E and Riegelmayer Kolodny Jill M
Current Estimated Value
Home Financials for this Owner
Home Financials are based on the most recent Mortgage that was taken out on this home.
Original Mortgage
$228,375
Outstanding Balance
$147,182
Interest Rate
6.05%
Mortgage Type
FHA
Estimated Equity
$204,741
Purchase Details
Closed on
Aug 6, 2004
Sold by
Skufca Sherry M and Rosebrook Sherry
Bought by
Skufca Matthew R
Purchase Details
Closed on
Oct 17, 1986
Sold by
Ponikvar Anthony J and Ponikvar Diane
Bought by
Skufca Matthew
Purchase Details
Closed on
Dec 1, 1983
Sold by
Anter Edward E and Anter Dolores A
Bought by
Ponikvar Anthony J and Ponikvar Diane
Purchase Details
Closed on
Jan 1, 1975
Bought by
Anter Edward E and Anter Dolores A
Create a Home Valuation Report for This Property
The Home Valuation Report is an in-depth analysis detailing your home's value as well as a comparison with similar homes in the area
Home Values in the Area
Average Home Value in this Area
Purchase History
| Date | Buyer | Sale Price | Title Company |
|---|---|---|---|
| Kolodny John E | $250,000 | Chicago Title Insurance Co | |
| Skufca Matthew R | -- | -- | |
| Skufca Matthew | -- | -- | |
| Ponikvar Anthony J | -- | -- | |
| Anter Edward E | -- | -- |
Source: Public Records
Mortgage History
| Date | Status | Borrower | Loan Amount |
|---|---|---|---|
| Open | Kolodny John E | $228,375 |
Source: Public Records
Tax History Compared to Growth
Tax History
| Year | Tax Paid | Tax Assessment Tax Assessment Total Assessment is a certain percentage of the fair market value that is determined by local assessors to be the total taxable value of land and additions on the property. | Land | Improvement |
|---|---|---|---|---|
| 2024 | $7,379 | $110,355 | $13,090 | $97,265 |
| 2023 | $6,105 | $78,750 | $12,110 | $66,640 |
| 2022 | $6,071 | $78,750 | $12,110 | $66,640 |
| 2021 | $6,014 | $78,750 | $12,110 | $66,640 |
| 2020 | $5,392 | $61,040 | $9,380 | $51,660 |
| 2019 | $4,994 | $174,400 | $26,800 | $147,600 |
| 2018 | $4,978 | $61,040 | $9,380 | $51,660 |
| 2017 | $5,448 | $64,440 | $7,980 | $56,460 |
| 2016 | $5,407 | $64,440 | $7,980 | $56,460 |
| 2015 | $5,428 | $64,440 | $7,980 | $56,460 |
| 2014 | $5,428 | $64,440 | $7,980 | $56,460 |
Source: Public Records
Map
Nearby Homes
- 1917 Alvin Ave
- 4771 S Hills Dr
- 4859 W 13th St
- 4884 W 13th St
- 1917 Cypress Ave
- 1025 Timothy Ln
- 2137 Silverdale Ave
- 2018 Tampa Ave
- 902 Colonel Dr
- 4463 S Hills Dr
- 4475 W 12th St
- 624 Timothy Ln
- 2712 Ralph Ave
- 5231 W 16th St
- 2219 Hood Ave
- 2815 Tampa Ave
- 1825 Treadway Ave
- 1716 Tuxedo Ave
- 2831 Walbrook Ave
- 2810 Natchez Ave
- 1623 W Schaaf Rd
- 1607 W Schaaf Rd
- 1627 W Schaaf Rd
- 4761 Landchester Rd
- 4765 Landchester Rd
- 4770 Broadale Rd
- 1605 W Schaaf Rd
- 4771 Landchester Rd
- 4774 Broadale Rd
- 1612 W Schaaf Rd
- 1614 W Schaaf Rd
- 4767 Broadale Rd
- 1620 W Schaaf Rd
- 4777 Landchester Rd
- 1705 W Schaaf Rd
- 1624 W Schaaf Rd
- 1603 W Schaaf Rd
- 1703 Alvin Ave
- 1602 W Schaaf Rd
- 1628 W Schaaf Rd