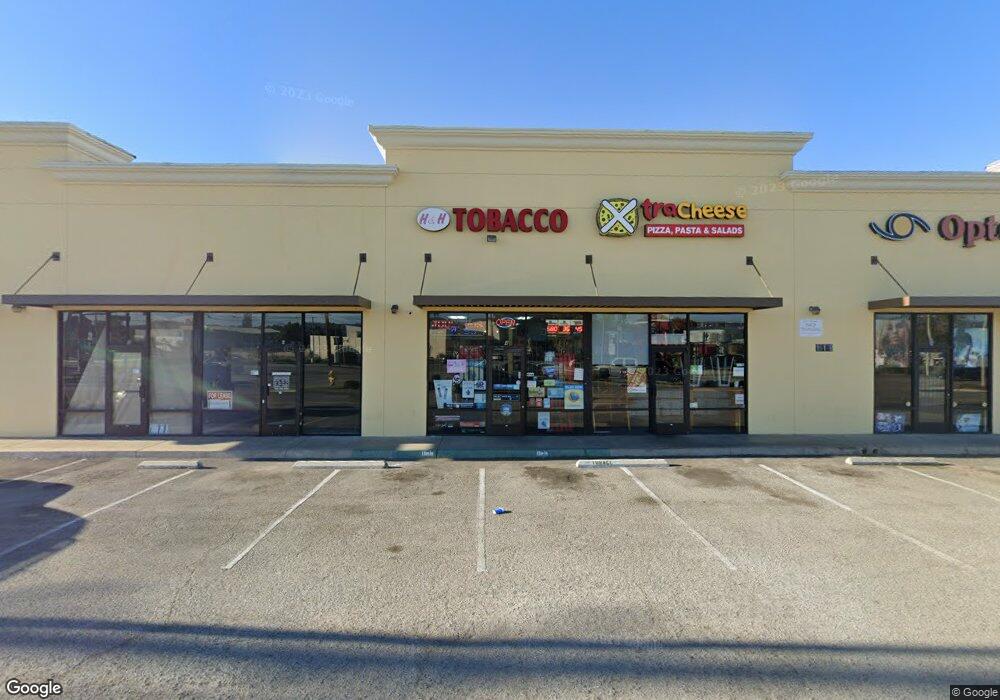
16170 Leffingwell Rd Whittier, CA 90603
South Whittier NeighborhoodEstimated Value: $2,920,436
--
Bed
--
Bath
5,852
Sq Ft
$499/Sq Ft
Est. Value
About This Home
This home is located at 16170 Leffingwell Rd, Whittier, CA 90603 and is currently estimated at $2,920,436, approximately $499 per square foot. 16170 Leffingwell Rd is a home located in Los Angeles County with nearby schools including Meadow Green Elementary School, Rancho-Starbuck Intermediate School, and La Habra High School.
Ownership History
Date
Name
Owned For
Owner Type
Purchase Details
Closed on
Apr 20, 2010
Sold by
Shih Chun Chieh Jack
Bought by
First Leffingwell Llc
Current Estimated Value
Purchase Details
Closed on
Apr 5, 2010
Sold by
Chan Shu Min
Bought by
Shih Chun Chieh Jack
Purchase Details
Closed on
Apr 2, 2010
Sold by
Ososz Whittier Llc
Bought by
Shih Chun Chieh Jack
Purchase Details
Closed on
Oct 24, 2009
Sold by
Nguyen Jennifer
Bought by
Ososz Whittier Llc
Purchase Details
Closed on
Apr 11, 2006
Sold by
Gabaee M M and Gabaee A
Bought by
Nguyen Jennifer
Home Financials for this Owner
Home Financials are based on the most recent Mortgage that was taken out on this home.
Original Mortgage
$1,000,000
Interest Rate
6.52%
Mortgage Type
Commercial
Purchase Details
Closed on
Mar 27, 2003
Sold by
Leffingwell & First Inc
Bought by
Gabaee M M and Gabaee A
Create a Home Valuation Report for This Property
The Home Valuation Report is an in-depth analysis detailing your home's value as well as a comparison with similar homes in the area
Home Values in the Area
Average Home Value in this Area
Purchase History
| Date | Buyer | Sale Price | Title Company |
|---|---|---|---|
| First Leffingwell Llc | -- | None Available | |
| Shih Chun Chieh Jack | -- | Chicago Title Company | |
| Shih Chun Chieh Jack | $1,200,000 | Chicago Title Company | |
| Ososz Whittier Llc | $1,039,407 | None Available | |
| Nguyen Jennifer | $1,980,000 | Stewart Title | |
| Gabaee M M | $415,000 | Stewart Title |
Source: Public Records
Mortgage History
| Date | Status | Borrower | Loan Amount |
|---|---|---|---|
| Previous Owner | Nguyen Jennifer | $1,000,000 |
Source: Public Records
Tax History Compared to Growth
Tax History
| Year | Tax Paid | Tax Assessment Tax Assessment Total Assessment is a certain percentage of the fair market value that is determined by local assessors to be the total taxable value of land and additions on the property. | Land | Improvement |
|---|---|---|---|---|
| 2025 | $20,907 | $1,590,426 | $1,246,931 | $343,495 |
| 2024 | $20,907 | $1,559,242 | $1,222,482 | $336,760 |
| 2023 | $20,459 | $1,528,669 | $1,198,512 | $330,157 |
| 2022 | $20,059 | $1,498,696 | $1,175,012 | $323,684 |
| 2021 | $19,594 | $1,469,311 | $1,151,973 | $317,338 |
| 2019 | $19,154 | $1,425,732 | $1,117,805 | $307,927 |
| 2018 | $18,163 | $1,397,778 | $1,095,888 | $301,890 |
| 2016 | $17,699 | $1,343,502 | $1,053,334 | $290,168 |
| 2015 | $16,670 | $1,323,322 | $1,037,512 | $285,810 |
| 2014 | -- | $1,297,401 | $1,017,189 | $280,212 |
Source: Public Records
Map
Nearby Homes
- 16040 Leffingwell Rd Unit 76
- 16040 Leffingwell Rd Unit 103
- 16040 Leffingwell Rd Unit 92
- 16036 Hornell St
- 11315 Groveside Ave
- 10931 Groveside Ave
- 10930 Groveland Ave
- 10930 Grovedale Dr
- 15952 Norcrest Dr
- 11518 1st Ave
- 11503 Grovedale Dr
- 11509 Grovedale Dr
- 16048 Richvale Dr
- Plan 3 at Rosewood Village
- Plan 1 at Rosewood Village
- Plan 2 at Rosewood Village
- 16036 Richvale Dr
- 15914 Lashburn St
- 16121 Lisco St
- 10732 Lindesmith Ave
- 16204 Heathfield Dr
- 16214 Heathfield Dr
- 11121 1st Ave
- 11137 1st Ave
- 16220 Heathfield Dr
- 11027 1st Ave
- 16226 Heathfield Dr
- 16222 Leffingwell Rd
- 16232 Heathfield Dr
- 16040 Leffingwell Rd Unit 61 - Summerwoods 61
- 16205 Rutherglen St
- 16228 Leffingwell Rd
- 16238 Heathfield Dr
- 16040 Leffingwell Rd Unit 38
- 16040 Leffingwell Rd Unit 54
- 16040 Leffingwell Rd Unit 88
- 16040 Leffingwell Rd Unit 40
- 16040 Leffingwell Rd Unit 37
- 16040 Leffingwell Rd Unit 116
- 16040 Leffingwell Rd Unit 96