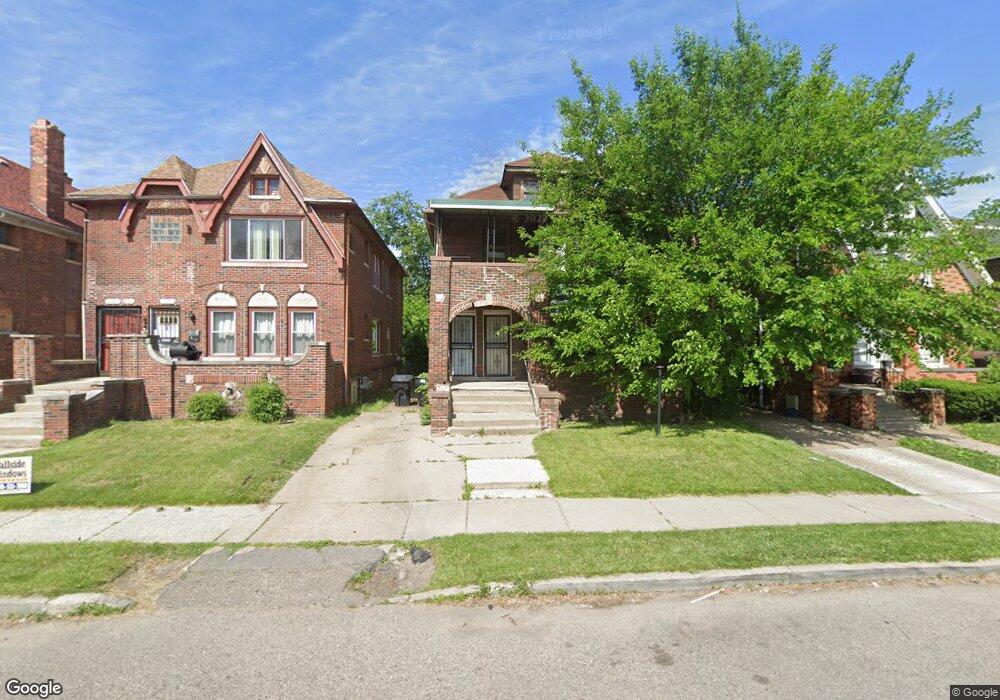
16175 Fairfield St Detroit, MI 48221
Martin Park NeighborhoodEstimated Value: $166,699 - $246,000
--
Bed
3
Baths
2,600
Sq Ft
$76/Sq Ft
Est. Value
About This Home
This home is located at 16175 Fairfield St, Detroit, MI 48221 and is currently estimated at $197,925, approximately $76 per square foot. 16175 Fairfield St is a home located in Wayne County with nearby schools including Paul Robeson Malcolm X Academy, Charles L. Spain Elementary-Middle School, and Edward 'Duke' Ellington Conservatory of Music and Art.
Ownership History
Date
Name
Owned For
Owner Type
Purchase Details
Closed on
Jan 19, 2023
Sold by
Coon James
Bought by
Porter Leroy
Current Estimated Value
Purchase Details
Closed on
Nov 25, 2019
Sold by
Porter Leroy
Bought by
Coon James
Purchase Details
Closed on
Sep 16, 2011
Sold by
Madden Delano
Bought by
Porter Leroy
Purchase Details
Closed on
Dec 24, 2009
Sold by
Odoms Steven A and Odoms Sherita
Bought by
Federal National Mortgage Association
Purchase Details
Closed on
Oct 13, 2009
Sold by
Mortgage Electronic Registration Systems
Bought by
Federal National Mortgage Association
Purchase Details
Closed on
Oct 7, 2009
Sold by
Odoms Steven A and Odoms Sherita
Bought by
Mortgage Electronic Registration Systems
Purchase Details
Closed on
Feb 26, 2004
Sold by
The Mortgage Academy Llc
Bought by
Odoms Steven A
Purchase Details
Closed on
Feb 27, 2003
Sold by
Odoms Steven A
Bought by
The Mortgage Academy Llc
Create a Home Valuation Report for This Property
The Home Valuation Report is an in-depth analysis detailing your home's value as well as a comparison with similar homes in the area
Home Values in the Area
Average Home Value in this Area
Purchase History
| Date | Buyer | Sale Price | Title Company |
|---|---|---|---|
| Porter Leroy | -- | -- | |
| Coon James | -- | None Available | |
| Porter Leroy | -- | None Available | |
| Federal National Mortgage Association | $2,000 | None Available | |
| Federal National Mortgage Association | -- | None Available | |
| Mortgage Electronic Registration Systems | $103,416 | None Available | |
| Odoms Steven A | -- | Lawyers Title Ins | |
| The Mortgage Academy Llc | -- | -- |
Source: Public Records
Tax History Compared to Growth
Tax History
| Year | Tax Paid | Tax Assessment Tax Assessment Total Assessment is a certain percentage of the fair market value that is determined by local assessors to be the total taxable value of land and additions on the property. | Land | Improvement |
|---|---|---|---|---|
| 2025 | $2,699 | $76,700 | $0 | $0 |
| 2024 | $2,699 | $64,400 | $0 | $0 |
| 2023 | $2,870 | $50,600 | $0 | $0 |
| 2022 | $3,076 | $39,600 | $0 | $0 |
| 2021 | $2,985 | $30,300 | $0 | $0 |
| 2020 | $1,795 | $26,000 | $0 | $0 |
| 2019 | $1,572 | $19,000 | $0 | $0 |
| 2018 | $1,387 | $16,400 | $0 | $0 |
| 2017 | $253 | $16,500 | $0 | $0 |
| 2016 | $1,514 | $32,500 | $0 | $0 |
| 2015 | $1,550 | $15,500 | $0 | $0 |
| 2013 | $2,484 | $24,835 | $0 | $0 |
| 2010 | -- | $34,470 | $845 | $33,625 |
Source: Public Records
Map
Nearby Homes
- 16182 Fairfield St
- 16167 Muirland St
- 16211 Muirland St
- 16239 Muirland St
- 16126 Dexter Ave
- 15904 Muirland St
- 7126 Puritan Ave
- 7147 Puritan Ave
- 7419 Puritan Ave
- 16554 Muirland St
- 16533 Parkside St
- 15828 Belden St
- 15822 Fairfield St
- 15840 Dexter Ave
- 16532 Parkside St
- 15798 Muirland St
- 16200 Lawton St
- 15751 Fairfield St
- 16133 Princeton St
- 16834 Muirland St
- 16169 Fairfield St
- 16161 Fairfield St
- 16183 Fairfield St
- 16191 Fairfield St
- 16243 Fairfield St
- 16197 Fairfield St
- 16235 Fairfield St
- 16153 Fairfield St
- 16172 Dexter Ave
- 16205 Fairfield St
- 16180 Dexter Ave
- 16166 Dexter Ave
- 16147 Fairfield St
- 16147 Fairfield St
- 16158 Dexter Ave
- 16211 Fairfield St Unit Bldg-Unit
- 16211 Fairfield St
- 16176 Fairfield St
- 16176 Fairfield St
- 16168 Fairfield St