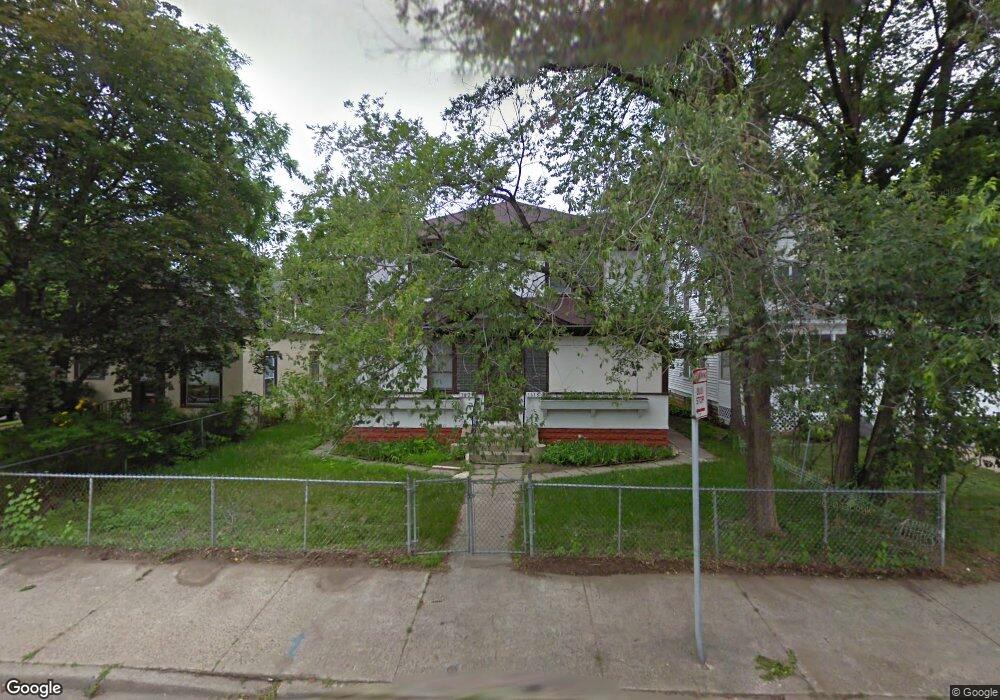
1618 44th Ave N Minneapolis, MN 55412
Webber-Camden NeighborhoodEstimated Value: $281,000 - $314,000
4
Beds
2
Baths
1,920
Sq Ft
$157/Sq Ft
Est. Value
About This Home
This home is located at 1618 44th Ave N, Minneapolis, MN 55412 and is currently estimated at $300,930, approximately $156 per square foot. 1618 44th Ave N is a home located in Hennepin County with nearby schools including Loring Elementary School, Olson Middle School, and Sojourner Truth Academy.
Ownership History
Date
Name
Owned For
Owner Type
Purchase Details
Closed on
Dec 16, 2019
Sold by
Sibri Jorge R Bonete and Quintero Karen G
Bought by
County Of Hennepin
Current Estimated Value
Purchase Details
Closed on
Sep 18, 2017
Sold by
Yang Bee Boonsavang and Lor Houa
Bought by
Bonete Sibri Jorge R
Home Financials for this Owner
Home Financials are based on the most recent Mortgage that was taken out on this home.
Original Mortgage
$176,739
Interest Rate
4.12%
Mortgage Type
FHA
Purchase Details
Closed on
Oct 27, 2008
Sold by
U S Bank Na
Bought by
Yang Bee and Not Provided
Purchase Details
Closed on
Aug 29, 2006
Sold by
London Sophia
Bought by
Sanchez Maria
Purchase Details
Closed on
Mar 31, 2005
Sold by
Thao Dual Cykao
Bought by
London Sophia and London Jose
Purchase Details
Closed on
Mar 27, 1997
Sold by
Estate Of Andrew J Poshek
Bought by
Yang Xong and Yang Vang
Create a Home Valuation Report for This Property
The Home Valuation Report is an in-depth analysis detailing your home's value as well as a comparison with similar homes in the area
Home Values in the Area
Average Home Value in this Area
Purchase History
| Date | Buyer | Sale Price | Title Company |
|---|---|---|---|
| County Of Hennepin | -- | None Available | |
| Bonete Sibri Jorge R | $180,000 | Titlesmart Inc | |
| Yang Bee | $55,000 | -- | |
| Sanchez Maria | $248,000 | -- | |
| London Sophia | $226,000 | -- | |
| Yang Xong | $68,000 | -- |
Source: Public Records
Mortgage History
| Date | Status | Borrower | Loan Amount |
|---|---|---|---|
| Previous Owner | Bonete Sibri Jorge R | $176,739 |
Source: Public Records
Tax History Compared to Growth
Tax History
| Year | Tax Paid | Tax Assessment Tax Assessment Total Assessment is a certain percentage of the fair market value that is determined by local assessors to be the total taxable value of land and additions on the property. | Land | Improvement |
|---|---|---|---|---|
| 2024 | $3,929 | $285,000 | $37,000 | $248,000 |
| 2023 | $3,554 | $276,000 | $32,000 | $244,000 |
| 2022 | $3,257 | $256,000 | $28,000 | $228,000 |
| 2021 | $2,909 | $241,000 | $8,000 | $233,000 |
| 2020 | $2,559 | $223,000 | $26,800 | $196,200 |
| 2019 | $2,221 | $186,000 | $18,400 | $167,600 |
| 2018 | $1,517 | $169,000 | $18,400 | $150,600 |
| 2017 | $1,289 | $108,500 | $16,700 | $91,800 |
| 2016 | $1,164 | $98,500 | $16,700 | $81,800 |
| 2015 | $1,415 | $98,500 | $16,700 | $81,800 |
| 2014 | -- | $92,000 | $16,700 | $75,300 |
Source: Public Records
Map
Nearby Homes
- 1801 44th Ave N
- 1806 44th Ave N
- 4344 Irving Ave N
- 4334 Fremont Ave N
- 4411 Oliver Ave N
- 4610 Oliver Ave N
- 4635 Emerson Ave N
- 4643 Emerson Ave N
- 4110 Irving Ave N
- 4625 Oliver Ave N
- 4502 Colfax Ave N
- 4701 Dupont Ave N
- 4543 Aldrich Ave N
- 4106 Dupont Ave N
- 4111 Bryant Ave N
- 4918 Morgan Ave N
- 2600 Victory Memorial Dr
- 4021 Colfax Ave N
- 4010 Dupont Ave N
- 4933 Fremont Ave N
- 1618/20 44th Ave N
- 1626 1626 44th-Avenue-n
- 1626 44th Ave N
- 1616 44th Ave N
- 4410 James Ave N
- 4412 James Ave N
- 1704 44th Ave N
- 4401 Irving Ave N Unit 1610
- 4401 Irving Ave N
- 4407 Irving Ave N
- 1701 44th Ave N
- 4416 James Ave N
- 4411 Irving Ave N
- 4415 Irving Ave N
- 1709 44th Ave N
- 4413 James Ave N
- 1710 44th Ave N
- 1715 44th Ave N
- 4422 James Ave N
- 4359 James Ave N