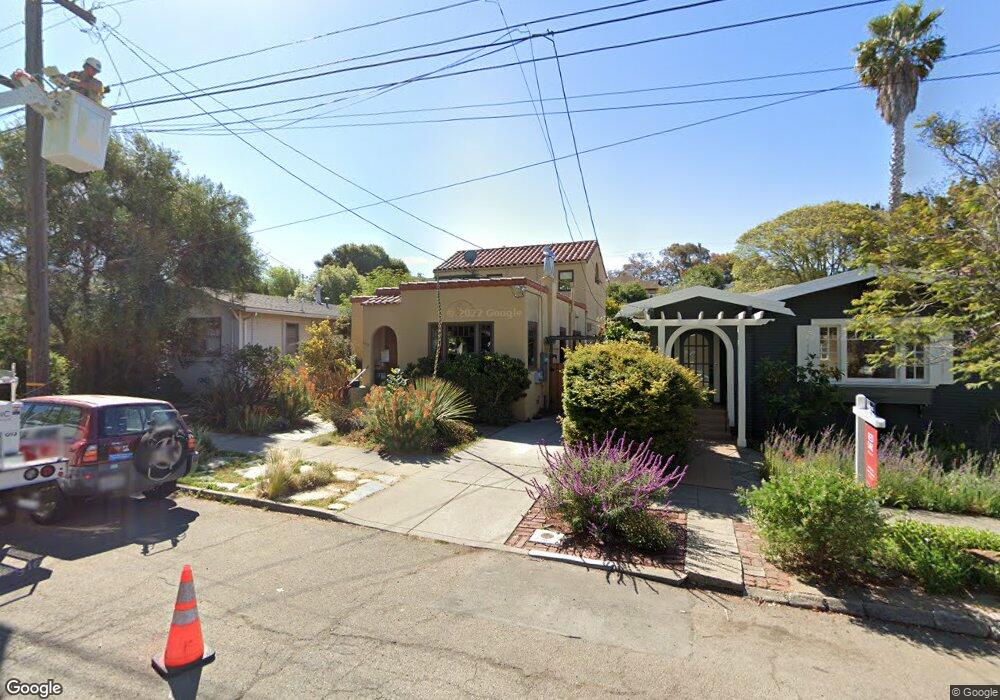
1618 Capistrano Ave Berkeley, CA 94707
Thousand Oaks NeighborhoodEstimated Value: $1,663,000 - $1,823,000
2
Beds
2
Baths
1,882
Sq Ft
$923/Sq Ft
Est. Value
About This Home
This home is located at 1618 Capistrano Ave, Berkeley, CA 94707 and is currently estimated at $1,737,347, approximately $923 per square foot. 1618 Capistrano Ave is a home located in Alameda County with nearby schools including Thousand Oaks Elementary School, Ruth Acty Elementary, and Berkeley Arts Magnet at Whittier School.
Ownership History
Date
Name
Owned For
Owner Type
Purchase Details
Closed on
Aug 25, 2006
Sold by
Peattie David and Grove Tanya D
Bought by
Peattie David and Grove Tanya D
Current Estimated Value
Purchase Details
Closed on
Jul 13, 2005
Sold by
Rohn Daniel T and Hui Janice S
Bought by
Peattie David and Grove Tanya D
Home Financials for this Owner
Home Financials are based on the most recent Mortgage that was taken out on this home.
Original Mortgage
$673,600
Outstanding Balance
$349,125
Interest Rate
5.55%
Mortgage Type
Fannie Mae Freddie Mac
Estimated Equity
$1,388,222
Purchase Details
Closed on
Mar 22, 2001
Sold by
Hodges Ulrike W and Hodges Robert M
Bought by
Rohn Daniel T and Hui Janice S
Home Financials for this Owner
Home Financials are based on the most recent Mortgage that was taken out on this home.
Original Mortgage
$430,000
Interest Rate
7.06%
Create a Home Valuation Report for This Property
The Home Valuation Report is an in-depth analysis detailing your home's value as well as a comparison with similar homes in the area
Home Values in the Area
Average Home Value in this Area
Purchase History
| Date | Buyer | Sale Price | Title Company |
|---|---|---|---|
| Peattie David | -- | None Available | |
| Peattie David | -- | None Available | |
| Peattie David | $842,000 | Placer Title Company | |
| Rohn Daniel T | $630,000 | Old Republic Title Company |
Source: Public Records
Mortgage History
| Date | Status | Borrower | Loan Amount |
|---|---|---|---|
| Open | Peattie David | $673,600 | |
| Previous Owner | Rohn Daniel T | $430,000 |
Source: Public Records
Tax History
| Year | Tax Paid | Tax Assessment Tax Assessment Total Assessment is a certain percentage of the fair market value that is determined by local assessors to be the total taxable value of land and additions on the property. | Land | Improvement |
|---|---|---|---|---|
| 2025 | $16,494 | $1,150,558 | $345,167 | $805,391 |
| 2024 | $16,494 | $1,128,001 | $338,400 | $789,601 |
| 2023 | $16,166 | $1,105,890 | $331,767 | $774,123 |
| 2022 | $15,906 | $1,084,208 | $325,262 | $758,946 |
| 2021 | $15,963 | $1,062,957 | $318,887 | $744,070 |
| 2020 | $15,175 | $1,052,061 | $315,618 | $736,443 |
| 2019 | $14,654 | $1,031,441 | $309,432 | $722,009 |
| 2018 | $14,427 | $1,011,224 | $303,367 | $707,857 |
| 2017 | $13,934 | $991,404 | $297,421 | $693,983 |
| 2016 | $13,542 | $971,970 | $291,591 | $680,379 |
| 2015 | $13,371 | $957,378 | $287,213 | $670,165 |
| 2014 | $13,299 | $938,627 | $281,588 | $657,039 |
Source: Public Records
Map
Nearby Homes
- 753 Peralta Ave
- 731 Santa fe Ave
- 1498 Sonoma Ave
- 1036 Ramona Ave
- 415 Berkeley Park Blvd
- 840 Key Route Blvd
- 1983 Yosemite Rd
- 1266 Washington Ave
- 712 Masonic Ave
- 1120 Curtis St
- 118 Ramona Ave
- 1236 Portland Ave
- 1127 Key Route Blvd
- 765 San Diego Rd
- 145 Ramona Ave
- 1950 Hopkins St
- 1626 Hopkins St
- 813 San Diego Rd
- 589 San Luis Rd
- 1136 Marin Ave
- 1614 Capistrano Ave
- 1624 Capistrano Ave
- 1630 Capistrano Ave
- 1604 Capistrano Ave
- 1623 Tacoma Ave
- 1629 Tacoma Ave
- 1617 Tacoma Ave
- 1598 Capistrano Ave
- 1635 Tacoma Ave
- 839 Miramar Ave
- 1644 Capistrano Ave
- 1641 Tacoma Ave
- 1594 Capistrano Ave
- 1635 Capistrano Ave
- 831 Miramar Ave
- 1654 Capistrano Ave
- 1647 Tacoma Ave
- 825 Miramar Ave
- 1597 Solano Ave
- 1582 Capistrano Ave
Your Personal Tour Guide
Ask me questions while you tour the home.