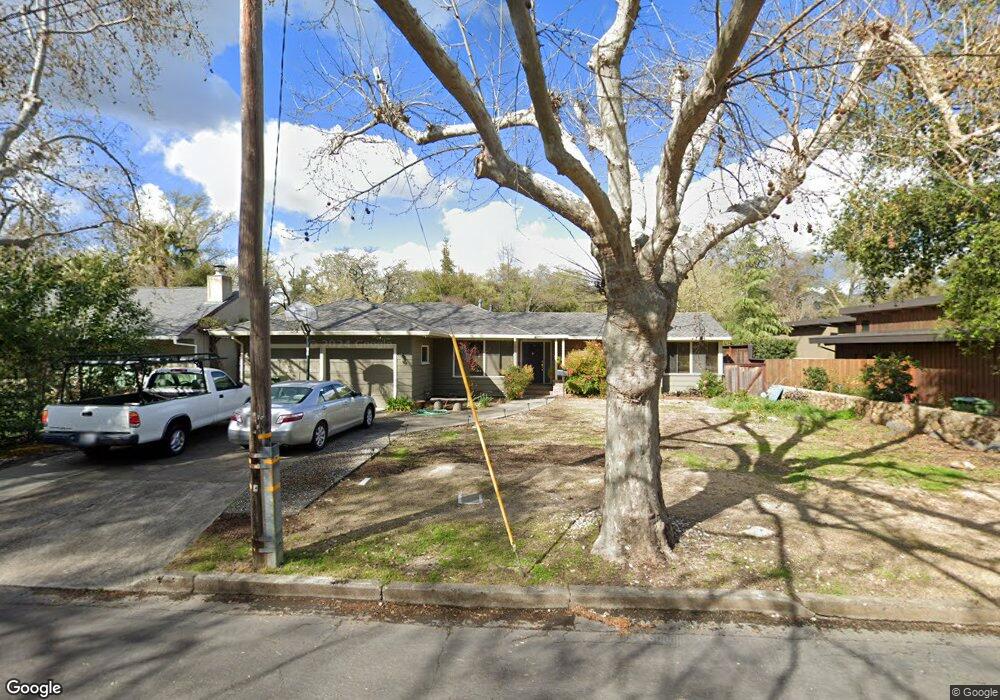
1618 Cedar St Calistoga, CA 94515
Estimated Value: $1,484,000 - $2,020,000
4
Beds
3
Baths
2,877
Sq Ft
$575/Sq Ft
Est. Value
About This Home
This home is located at 1618 Cedar St, Calistoga, CA 94515 and is currently estimated at $1,653,568, approximately $574 per square foot. 1618 Cedar St is a home located in Napa County with nearby schools including Calistoga Elementary School and Calistoga Junior/Senior High School.
Ownership History
Date
Name
Owned For
Owner Type
Purchase Details
Closed on
Jun 27, 2024
Sold by
Lilly Ronald J and Mangan Margaret C
Bought by
Lilly Mangan Family Living Trust and Lilly
Current Estimated Value
Purchase Details
Closed on
Jul 16, 2001
Sold by
Vossler John Thomas and Vossler Patricia Jane
Bought by
Lilly Ronald J and Mangan Margaret C
Home Financials for this Owner
Home Financials are based on the most recent Mortgage that was taken out on this home.
Original Mortgage
$540,000
Interest Rate
7.21%
Purchase Details
Closed on
Oct 13, 1998
Sold by
Jane Vossler John Thomas and Jane Patricia
Bought by
Vossler John Thomas and Vossler Patricia Jane
Purchase Details
Closed on
Nov 9, 1995
Sold by
Mitrovich Robert A and Mitrovich Vicky L
Bought by
Mitrovich Robert A and Mitrovich Vicky L
Home Financials for this Owner
Home Financials are based on the most recent Mortgage that was taken out on this home.
Original Mortgage
$122,000
Interest Rate
7.42%
Create a Home Valuation Report for This Property
The Home Valuation Report is an in-depth analysis detailing your home's value as well as a comparison with similar homes in the area
Home Values in the Area
Average Home Value in this Area
Purchase History
| Date | Buyer | Sale Price | Title Company |
|---|---|---|---|
| Lilly Mangan Family Living Trust | -- | None Listed On Document | |
| Lilly Ronald J | $705,000 | Napa Land Title Company | |
| Vossler John Thomas | -- | -- | |
| Mitrovich Robert A | -- | First American Title |
Source: Public Records
Mortgage History
| Date | Status | Borrower | Loan Amount |
|---|---|---|---|
| Previous Owner | Lilly Ronald J | $540,000 | |
| Previous Owner | Mitrovich Robert A | $122,000 |
Source: Public Records
Tax History
| Year | Tax Paid | Tax Assessment Tax Assessment Total Assessment is a certain percentage of the fair market value that is determined by local assessors to be the total taxable value of land and additions on the property. | Land | Improvement |
|---|---|---|---|---|
| 2025 | $11,289 | $1,043,944 | $421,023 | $622,921 |
| 2024 | $11,097 | $1,023,475 | $412,768 | $610,707 |
| 2023 | $11,097 | $1,003,408 | $404,675 | $598,733 |
| 2022 | $10,402 | $983,735 | $396,741 | $586,994 |
| 2021 | $10,080 | $964,447 | $388,962 | $575,485 |
| 2020 | $9,970 | $954,559 | $384,974 | $569,585 |
| 2019 | $9,842 | $935,843 | $377,426 | $558,417 |
| 2018 | $9,715 | $917,494 | $370,026 | $547,468 |
| 2017 | $9,518 | $899,505 | $362,771 | $536,734 |
| 2016 | $9,281 | $881,868 | $355,658 | $526,210 |
| 2015 | $9,172 | $868,622 | $350,316 | $518,306 |
| 2014 | $9,019 | $851,608 | $343,454 | $508,154 |
Source: Public Records
Map
Nearby Homes
- 3567 California 128
- 3027 Foothill Blvd
- 18276 California 128 Unit A
- 1411 4th St
- 1429 3rd St
- 1431 4th St
- 1231 Stevenson St
- 1559 Silverado Terrace Loop
- 1551 Silverado Terrace Loop
- 1557 Silverado Terrace Loop Unit 37
- 1553 Silverado Terrace Loop
- 1559 Silverado Terrace Loop Unit 38
- 1438 Grant St
- 2412 Foothill Blvd Unit 41
- 2412 Foothill Blvd Unit 42
- 2412 Foothill Blvd Unit 124
- 2412 Foothill Blvd Unit 63
- 2412 Foothill Blvd Unit 47
- 2412 Foothill Blvd Unit 173
- 2412 Foothill Blvd Unit 166
Your Personal Tour Guide
Ask me questions while you tour the home.