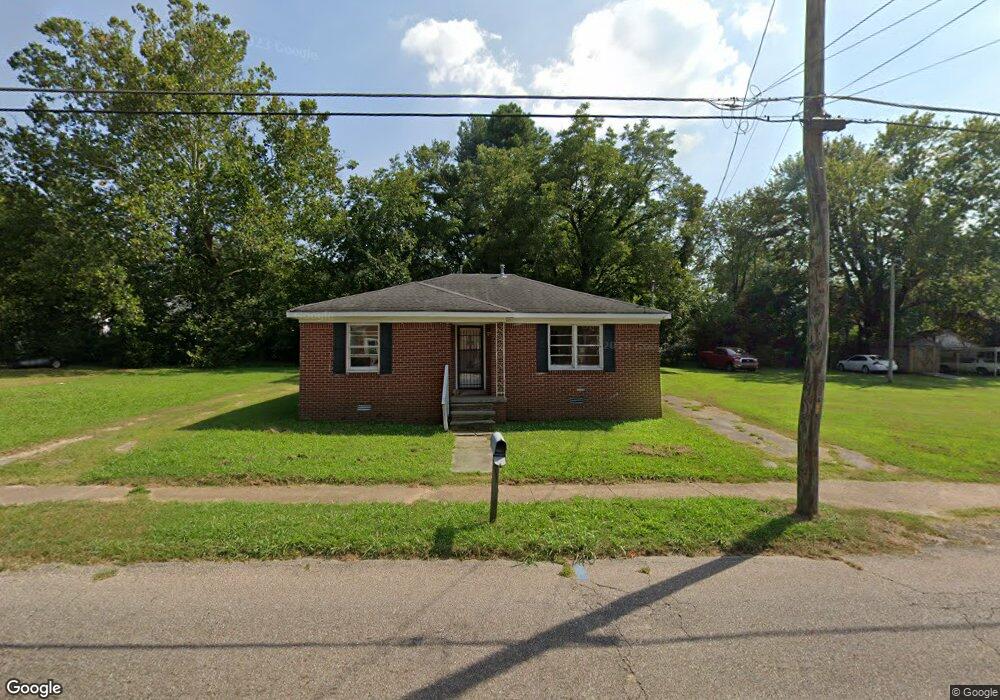
1618 E Mitchell St Humboldt, TN 38343
Estimated Value: $65,000 - $82,000
--
Bed
1
Bath
1,028
Sq Ft
$71/Sq Ft
Est. Value
About This Home
This home is located at 1618 E Mitchell St, Humboldt, TN 38343 and is currently estimated at $73,466, approximately $71 per square foot. 1618 E Mitchell St is a home located in Gibson County with nearby schools including Stigall Primary School, East Elementary School, and Humboldt Middle School.
Ownership History
Date
Name
Owned For
Owner Type
Purchase Details
Closed on
Feb 6, 2025
Sold by
Rowan William F and Potts Terri
Bought by
Jones Alma
Current Estimated Value
Purchase Details
Closed on
Oct 18, 2024
Sold by
Sfr Jackson Llc
Bought by
Rowan William F and Potts Rowan Terri
Home Financials for this Owner
Home Financials are based on the most recent Mortgage that was taken out on this home.
Original Mortgage
$90,052
Interest Rate
6.09%
Mortgage Type
Construction
Purchase Details
Closed on
Feb 22, 2022
Sold by
Merit Management Llc
Bought by
Sfr Jackson Llc
Purchase Details
Closed on
Mar 29, 2006
Sold by
Adams George
Bought by
Merit Management Llc
Purchase Details
Closed on
Dec 8, 2005
Sold by
Adams George
Bought by
Citifinancial Mortgage
Purchase Details
Closed on
May 12, 1989
Bought by
Adams George and Adams Carolyn
Create a Home Valuation Report for This Property
The Home Valuation Report is an in-depth analysis detailing your home's value as well as a comparison with similar homes in the area
Home Values in the Area
Average Home Value in this Area
Purchase History
| Date | Buyer | Sale Price | Title Company |
|---|---|---|---|
| Jones Alma | $72,500 | None Listed On Document | |
| Rowan William F | $57,000 | None Listed On Document | |
| Sfr Jackson Llc | $448,000 | None Listed On Document | |
| Merit Management Llc | $6,700 | -- | |
| Citifinancial Mortgage | $34,900 | -- | |
| Adams George | $25,000 | -- |
Source: Public Records
Mortgage History
| Date | Status | Borrower | Loan Amount |
|---|---|---|---|
| Previous Owner | Rowan William F | $90,052 | |
| Closed | Sfr Jackson Llc | $0 |
Source: Public Records
Tax History Compared to Growth
Tax History
| Year | Tax Paid | Tax Assessment Tax Assessment Total Assessment is a certain percentage of the fair market value that is determined by local assessors to be the total taxable value of land and additions on the property. | Land | Improvement |
|---|---|---|---|---|
| 2024 | $329 | $12,150 | $2,250 | $9,900 |
| 2023 | $73 | $6,600 | $1,000 | $5,600 |
| 2022 | $68 | $6,600 | $1,000 | $5,600 |
| 2021 | $68 | $6,600 | $1,000 | $5,600 |
| 2020 | $248 | $6,600 | $1,000 | $5,600 |
| 2019 | $248 | $6,600 | $1,000 | $5,600 |
| 2018 | $272 | $6,700 | $1,000 | $5,700 |
| 2017 | $269 | $6,700 | $1,000 | $5,700 |
| 2016 | $269 | $6,700 | $1,000 | $5,700 |
| 2015 | $266 | $6,700 | $1,000 | $5,700 |
| 2014 | $266 | $6,700 | $1,000 | $5,700 |
Source: Public Records
Map
Nearby Homes
- 405 N 16th Ave
- 1635 Osborne St
- 1509 Vine St
- 700 N 18th Ave
- 1907 E Mitchell St
- 112 S 17th Ave
- 0 Calhoun Etheridge & Rr Unit 246886
- 106 S 13th Ave
- 1325 N 17th Ave
- 0 +-6 Acres Gadsden Todd Levee Unit 241321
- 1416 N 18th Ave
- 811 N 24th Ave
- 2107 Campbell St
- 1438 N 19th Ave
- 2425 St Mary Dr
- 2508 Vine St
- 0 W Main St
- 623 Forest Dr
- 214 Vine St
- 1338 Dungan St
- 1622 E Mitchell St
- 1614 E Mitchell St
- 1626 E Mitchell St
- 1621 Maple St
- 1606 E Mitchell St
- 1613 E Mitchell St
- 1627 Maple St Unit 1633
- 1605 Maple St
- 1615 Maple St Unit 1613
- 1604 E Mitchell St
- 1627 E Mitchell St
- 1607 E Mitchell St
- 1603 Maple St
- 1636 E Mitchell St
- 1647 Maple St
- 1612 Maple St
- 1603 E Mitchell St Unit 1603
- 1620 Maple St
- 412 N 16th Ave
- 1645 E Mitchell St