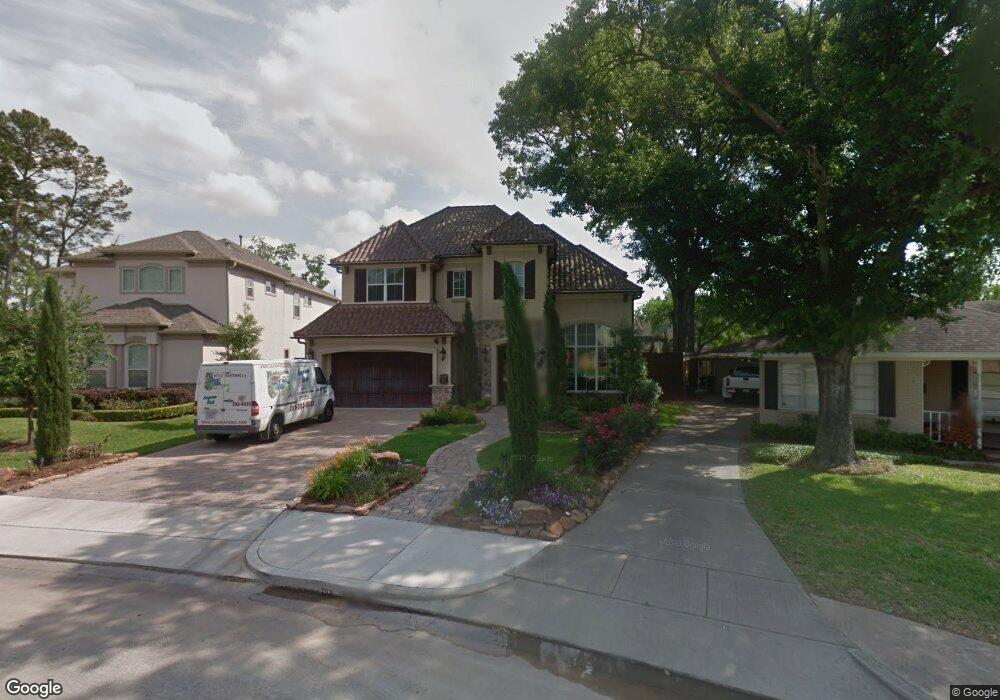
1618 Glourie Dr Houston, TX 77055
Spring Branch East NeighborhoodEstimated Value: $1,139,000 - $1,789,000
3
Beds
2
Baths
1,321
Sq Ft
$1,221/Sq Ft
Est. Value
About This Home
This home is located at 1618 Glourie Dr, Houston, TX 77055 and is currently estimated at $1,612,545, approximately $1,220 per square foot. 1618 Glourie Dr is a home located in Harris County with nearby schools including Valley Oaks Elementary School, Landrum Middle School, and Memorial High School.
Ownership History
Date
Name
Owned For
Owner Type
Purchase Details
Closed on
Apr 8, 2021
Sold by
Hawkins Rowland S
Bought by
Lum Rebecca S
Current Estimated Value
Purchase Details
Closed on
Aug 25, 2008
Sold by
Goolsbee Charles T and Goolsbee Carol B
Bought by
Lum Rebecca S
Purchase Details
Closed on
May 15, 2008
Sold by
Blumberg Adam S and Blumberg Camila
Bought by
Goolsbee Charles T and Goolsbee Carol B
Purchase Details
Closed on
Mar 8, 2007
Sold by
Epley Nancy V
Bought by
Blumberg Adam S and Blumberg Camila
Home Financials for this Owner
Home Financials are based on the most recent Mortgage that was taken out on this home.
Original Mortgage
$175,000
Interest Rate
6.25%
Mortgage Type
Purchase Money Mortgage
Purchase Details
Closed on
May 21, 1996
Sold by
Mccarty Melissa Sellers and Mccarty Timothy D
Bought by
Epley Nancy
Create a Home Valuation Report for This Property
The Home Valuation Report is an in-depth analysis detailing your home's value as well as a comparison with similar homes in the area
Home Values in the Area
Average Home Value in this Area
Purchase History
| Date | Buyer | Sale Price | Title Company |
|---|---|---|---|
| Lum Rebecca S | -- | None Listed On Document | |
| Lum Rebecca S | -- | First American Title | |
| Goolsbee Charles T | -- | First American Title | |
| Blumberg Adam S | -- | Startex Title Company | |
| Epley Nancy | -- | Lawyers Title Co |
Source: Public Records
Mortgage History
| Date | Status | Borrower | Loan Amount |
|---|---|---|---|
| Previous Owner | Blumberg Adam S | $175,000 | |
| Closed | Epley Nancy | $0 |
Source: Public Records
Tax History Compared to Growth
Tax History
| Year | Tax Paid | Tax Assessment Tax Assessment Total Assessment is a certain percentage of the fair market value that is determined by local assessors to be the total taxable value of land and additions on the property. | Land | Improvement |
|---|---|---|---|---|
| 2025 | $19,883 | $1,558,019 | $740,460 | $817,559 |
| 2024 | $19,883 | $1,711,896 | $740,460 | $971,436 |
| 2023 | $19,883 | $1,598,000 | $687,570 | $910,430 |
| 2022 | $8,344 | $1,294,341 | $634,680 | $659,661 |
| 2021 | $33,099 | $1,286,221 | $581,790 | $704,431 |
| 2020 | $32,570 | $1,250,000 | $581,790 | $668,210 |
| 2019 | $35,441 | $1,303,946 | $581,790 | $722,156 |
| 2018 | $12,450 | $1,272,000 | $423,120 | $848,880 |
| 2017 | $33,184 | $1,272,000 | $423,120 | $848,880 |
| 2016 | $30,167 | $1,288,000 | $401,964 | $886,036 |
| 2015 | $20,083 | $1,229,000 | $401,964 | $827,036 |
| 2014 | $20,083 | $953,000 | $317,340 | $635,660 |
Source: Public Records
Map
Nearby Homes
- 7938 S Wellington Ct
- 7908 Westwood Dr
- 1523 Cunningham Parc Ln
- 1724 Maravilla Dr
- 1731 French Village Dr
- 7903 S Wellington Ct
- 1529 Wirt Rd Unit 27
- 1529 Wirt Rd Unit 6
- 1529 Wirt Rd Unit 19
- 1529 Wirt Rd Unit 20
- 0 Wirt Rd
- 7818 Janak Dr Unit B
- 1720 Huge Oaks St
- 1519 Baggett Ln
- 1421 Glenmore Forest St
- 1614 Johanna Dr Unit C
- 1518 Hillendahl Blvd
- 8707 Padua Ln
- 7714 Janak Dr
- 8306 Ginger Oak St
- 1622 Glourie Dr
- 1614 Glourie Dr
- 1627 Gingerleaf Ln
- 1631 Gingerleaf Ln
- 1623 Gingerleaf Ln
- 1635 Gingerleaf Ln
- 1626 Glourie Dr
- 1619 Gingerleaf Ln
- 1639 Gingerleaf Ln
- 1610 Glourie Dr
- 1615 Gingerleaf Ln
- 1800 Spenwick Dr
- 1643 Gingerleaf Ln
- 1632 Glourie Dr
- 1630 Glourie Dr
- 1611 Gingerleaf Ln
- 1606 Glourie Dr
- 1703 Gingerleaf Ln
- 1609 Glourie Dr
- 1607 Gingerleaf Ln