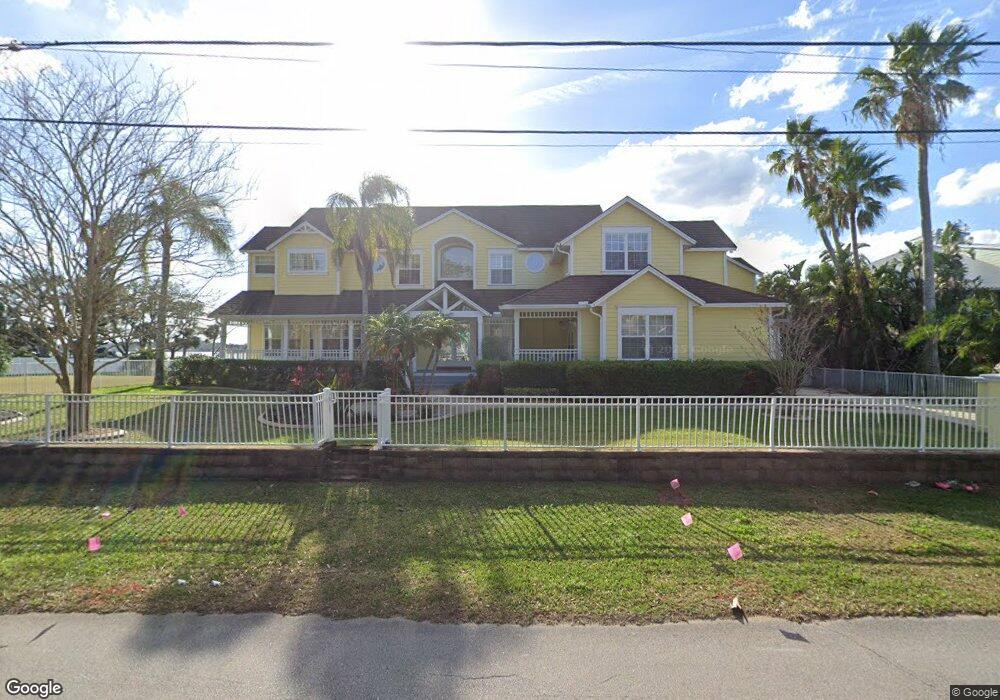
1618 John Anderson Dr Ormond Beach, FL 32176
Estimated Value: $2,445,000 - $2,926,877
5
Beds
4
Baths
6,394
Sq Ft
$410/Sq Ft
Est. Value
About This Home
This home is located at 1618 John Anderson Dr, Ormond Beach, FL 32176 and is currently estimated at $2,619,626, approximately $409 per square foot. 1618 John Anderson Dr is a home located in Volusia County with nearby schools including Ormond Beach Middle School, Seabreeze High School, and St Brendan Catholic School.
Ownership History
Date
Name
Owned For
Owner Type
Purchase Details
Closed on
Sep 28, 2012
Sold by
Denoon Janie L
Bought by
Croskey Helen Laurel and Denoon William G
Current Estimated Value
Purchase Details
Closed on
Jul 8, 2008
Sold by
Butler David L and Butler Cynthia
Bought by
Denoon William and Denoon Janie
Purchase Details
Closed on
Sep 20, 1999
Sold by
Edwards Mark S and Edwards Stephanie L
Bought by
Butler David L and Butler Cynthia
Purchase Details
Closed on
Dec 14, 1993
Sold by
Carlson Dean and Carlson Robert D
Bought by
Carlson Robert D and Carlson Michelle R
Purchase Details
Closed on
Sep 15, 1992
Bought by
Croskey Helen Laurel Tr
Purchase Details
Closed on
Sep 15, 1986
Bought by
Croskey Helen Laurel Tr
Purchase Details
Closed on
Jun 15, 1976
Bought by
Croskey Helen Laurel Tr
Create a Home Valuation Report for This Property
The Home Valuation Report is an in-depth analysis detailing your home's value as well as a comparison with similar homes in the area
Home Values in the Area
Average Home Value in this Area
Purchase History
| Date | Buyer | Sale Price | Title Company |
|---|---|---|---|
| Croskey Helen Laurel | -- | Attorney | |
| Denoon William | $1,688,500 | Adams Cameron Title Svcs Inc | |
| Butler David L | $775,000 | -- | |
| Carlson Robert D | -- | -- | |
| Croskey Helen Laurel Tr | $100 | -- | |
| Croskey Helen Laurel Tr | $380,000 | -- | |
| Croskey Helen Laurel Tr | $165,000 | -- |
Source: Public Records
Tax History
| Year | Tax Paid | Tax Assessment Tax Assessment Total Assessment is a certain percentage of the fair market value that is determined by local assessors to be the total taxable value of land and additions on the property. | Land | Improvement |
|---|---|---|---|---|
| 2026 | $37,156 | $2,212,718 | $679,754 | $1,532,964 |
| 2025 | $37,156 | $2,212,718 | $679,754 | $1,532,964 |
| 2024 | $33,305 | $2,241,419 | $679,754 | $1,561,665 |
| 2023 | $33,305 | $2,120,799 | $715,530 | $1,405,269 |
| 2022 | $30,025 | $1,762,119 | $524,918 | $1,237,201 |
| 2021 | $28,133 | $1,422,867 | $486,795 | $936,072 |
| 2020 | $26,145 | $1,351,554 | $482,023 | $869,531 |
| 2019 | $23,957 | $1,188,684 | $447,178 | $741,506 |
| 2018 | $22,934 | $1,119,783 | $399,992 | $719,791 |
| 2017 | $24,631 | $1,165,833 | $400,352 | $765,481 |
| 2016 | $25,105 | $1,149,728 | $0 | $0 |
| 2015 | $25,380 | $1,121,971 | $0 | $0 |
| 2014 | $23,339 | $1,042,671 | $0 | $0 |
Source: Public Records
Map
Nearby Homes
- 3668 John Anderson Dr
- 4310 John Anderson Dr
- 55 Seaside Dr
- 56 Margaret Rd
- 37 Seaside Dr
- 36 River Shore Dr
- 31 River Shore Dr
- 29 Ocean Shore Dr
- 40 Azalea Dr
- 149 Roberta Rd
- 30 Azalea Dr
- 4 Ocean Shore Dr
- 20 Concord Dr
- 17 Poinsettia Dr
- 42 Palmetto Dr
- 49 Alamanda Dr
- 26 Palm Dr
- 1510 Ocean Shore Blvd Unit 3150
- 1510 Ocean Shore Blvd Unit 4140
- 1510 Ocean Shore Blvd Unit 4150
- 1638 John Anderson Dr
- 1625 John Anderson Dr
- 1631 John Anderson Dr
- 1621 John Anderson Dr
- 1633 John Anderson Dr
- 1648 John Anderson Dr
- 1639 John Anderson Dr
- 1586 John Anderson Dr
- 65 River Shore Dr
- 1608 John Anderson Dr
- 2146 John Anderson Dr
- 588 John Anderson Dr
- 2903 John Anderson Dr
- 3695 John Anderson Dr
- 1591 John Anderson Dr
- 63 Seaside Dr
- 64 River Shore Dr
- 1653 John Anderson Dr
- 1583 John Anderson Dr
- 58 Seaside Dr
Your Personal Tour Guide
Ask me questions while you tour the home.