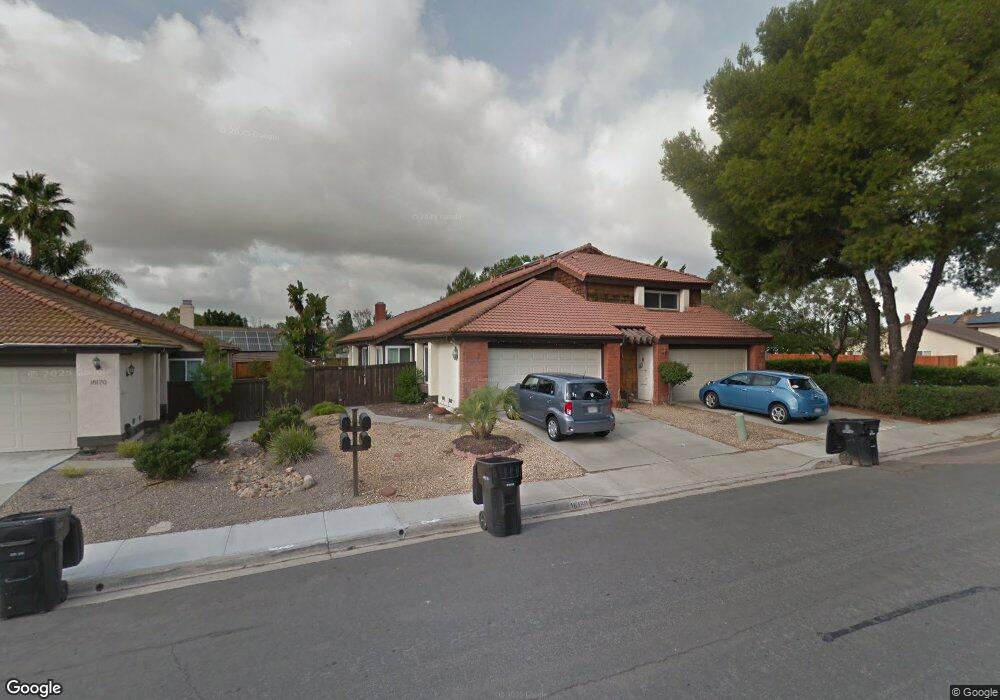
16180 Turtleback Rd San Diego, CA 92127
Rancho Bernardo NeighborhoodEstimated Value: $840,126 - $1,020,000
2
Beds
2
Baths
1,240
Sq Ft
$757/Sq Ft
Est. Value
About This Home
This home is located at 16180 Turtleback Rd, San Diego, CA 92127 and is currently estimated at $938,782, approximately $757 per square foot. 16180 Turtleback Rd is a home located in San Diego County with nearby schools including Turtleback Elementary, Bernardo Heights Middle, and Rancho Bernardo High.
Ownership History
Date
Name
Owned For
Owner Type
Purchase Details
Closed on
Dec 21, 2006
Sold by
Yoder John Wallace and Yoder Virginia Kathleen
Bought by
Werkheiser Scott and Werkheiser Shelli
Current Estimated Value
Home Financials for this Owner
Home Financials are based on the most recent Mortgage that was taken out on this home.
Original Mortgage
$336,000
Outstanding Balance
$211,146
Interest Rate
7.25%
Mortgage Type
New Conventional
Estimated Equity
$727,636
Purchase Details
Closed on
Oct 19, 2004
Sold by
Williams Margaret D
Bought by
Yoder John Wallace and Yoder Virginia Kathleen
Home Financials for this Owner
Home Financials are based on the most recent Mortgage that was taken out on this home.
Original Mortgage
$343,900
Interest Rate
5.87%
Mortgage Type
Unknown
Purchase Details
Closed on
Aug 19, 1986
Create a Home Valuation Report for This Property
The Home Valuation Report is an in-depth analysis detailing your home's value as well as a comparison with similar homes in the area
Home Values in the Area
Average Home Value in this Area
Purchase History
| Date | Buyer | Sale Price | Title Company |
|---|---|---|---|
| Werkheiser Scott | $420,000 | New Century Title Company | |
| Yoder John Wallace | $430,000 | Fidelity National Title Co | |
| -- | $115,000 | -- |
Source: Public Records
Mortgage History
| Date | Status | Borrower | Loan Amount |
|---|---|---|---|
| Open | Werkheiser Scott | $336,000 | |
| Previous Owner | Yoder John Wallace | $343,900 | |
| Closed | Yoder John Wallace | $85,950 |
Source: Public Records
Tax History
| Year | Tax Paid | Tax Assessment Tax Assessment Total Assessment is a certain percentage of the fair market value that is determined by local assessors to be the total taxable value of land and additions on the property. | Land | Improvement |
|---|---|---|---|---|
| 2025 | $6,266 | $562,688 | $401,923 | $160,765 |
| 2024 | $6,266 | $551,656 | $394,043 | $157,613 |
| 2023 | $6,133 | $540,840 | $386,317 | $154,523 |
| 2022 | $6,031 | $530,237 | $378,743 | $151,494 |
| 2021 | $5,953 | $519,841 | $371,317 | $148,524 |
| 2020 | $5,873 | $514,512 | $367,510 | $147,002 |
| 2019 | $5,721 | $504,424 | $360,304 | $144,120 |
| 2018 | $5,561 | $494,535 | $353,240 | $141,295 |
| 2017 | $5,413 | $484,839 | $346,314 | $138,525 |
| 2016 | $5,302 | $475,333 | $339,524 | $135,809 |
| 2015 | $5,224 | $468,195 | $334,425 | $133,770 |
| 2014 | $4,782 | $430,000 | $307,000 | $123,000 |
Source: Public Records
Map
Nearby Homes
- 11525 Eaglesview Ct Unit 4
- 15293 Maturin Dr Unit 91
- 15273 Maturin Dr Unit 40
- 15383 Maturin Dr Unit 221
- 15393 Maturin Dr Unit 243
- 11325 Avenida de Los Lobos
- 11337 Avenida de Los Lobos Unit C
- 11231 Avenida de Los Lobos Unit H
- 11705 Via Medanos
- 16244 Avenida Venusto Unit A
- 16232 Avenida Venusto Unit B
- 16458 Avenida Venusto Unit E
- 16458 Avenida Venusto Unit C
- 16464 Avenida Venusto
- 11602 Calle Paracho
- 12141 Iron View Row
- 15576 Paseo Ajanta
- 12131 View Pointe Row
- 12047 Avenida Consentido
- 11941 Callado Rd
- 16170 Turtleback Rd
- 16190 Turtleback Rd
- 11284 Trailside Ct
- 16160 Turtleback Rd
- 11266 Trailside Ct
- 11311 Cloudcrest Dr
- 16171 Turtleback Rd
- 16212 Turtleback Rd
- 11258 Trailside Ct
- 16148 Turtleback Rd
- 11255 Trailside Ct
- 16151 Turtleback Rd
- 16205 Rimstone Ln
- 16215 Rimstone Ln Unit 1
- 16140 Turtleback Rd
- 11321 Cloudcrest Dr
- 11250 Trailside Ct
- 16222 Turtleback Rd
- 11235 Trailside Ct
- 11310 Cloudcrest Dr
Your Personal Tour Guide
Ask me questions while you tour the home.