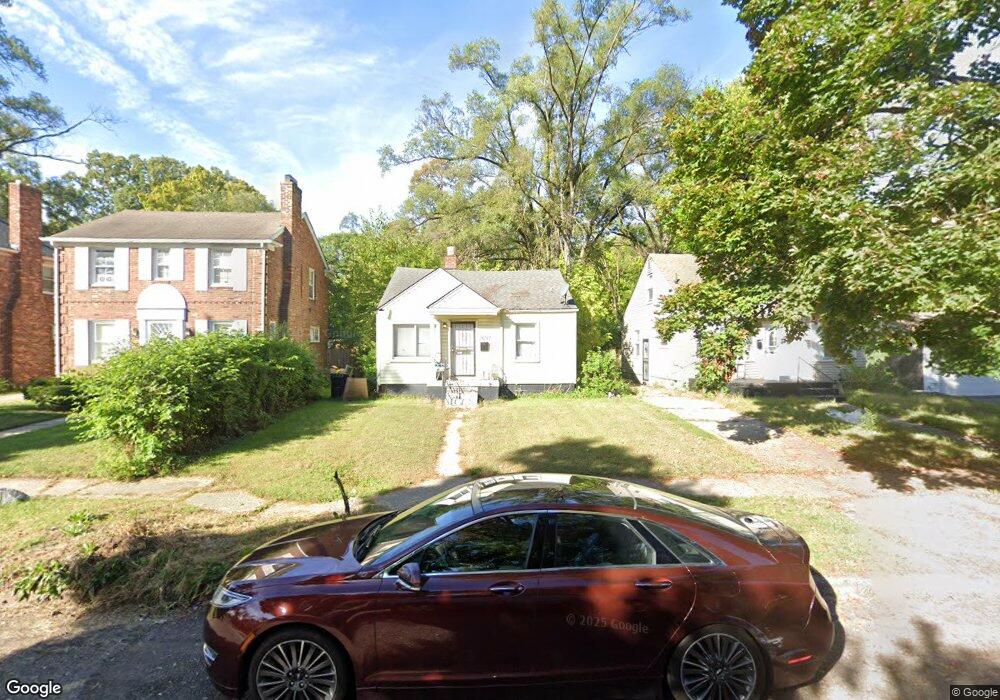
16187 Robson St Detroit, MI 48235
Hubbell-Puritan NeighborhoodEstimated Value: $64,000 - $75,000
2
Beds
1
Bath
672
Sq Ft
$103/Sq Ft
Est. Value
About This Home
This home is located at 16187 Robson St, Detroit, MI 48235 and is currently estimated at $68,911, approximately $102 per square foot. 16187 Robson St is a home located in Wayne County with nearby schools including Young Coleman A. Elementary School, John R. King Academic And Performing Arts Academy, and Charles L. Spain Elementary-Middle School.
Ownership History
Date
Name
Owned For
Owner Type
Purchase Details
Closed on
Feb 24, 2014
Sold by
Suburban Renaissance Vi Llc
Bought by
Berry Angelique Raquel
Current Estimated Value
Purchase Details
Closed on
Nov 16, 2012
Sold by
Wayne County Treasurer
Bought by
Suburban Renaissance Vi Llc
Purchase Details
Closed on
Apr 18, 2008
Sold by
Mortgage Electronic Registration Systems
Bought by
Deutsche Bank National Trust Co and Morgan Stanley Abs Capital I Inc Trust 2
Purchase Details
Closed on
Feb 20, 2008
Sold by
Mnayarji Joyce
Bought by
Mortgage Electronic Registration Systems
Purchase Details
Closed on
Sep 11, 2006
Sold by
Ace Industries Llc
Bought by
Mnayarji Joyce
Purchase Details
Closed on
May 18, 2006
Sold by
Arteaga Sufanita
Bought by
Ace Industries Llc
Purchase Details
Closed on
Mar 26, 2004
Sold by
Stewart Andrew and Pope Stewart Sislie
Bought by
Arteaga Sufanita
Create a Home Valuation Report for This Property
The Home Valuation Report is an in-depth analysis detailing your home's value as well as a comparison with similar homes in the area
Home Values in the Area
Average Home Value in this Area
Purchase History
| Date | Buyer | Sale Price | Title Company |
|---|---|---|---|
| Berry Angelique Raquel | $950 | None Available | |
| Suburban Renaissance Vi Llc | $1,368 | None Available | |
| Deutsche Bank National Trust Co | -- | None Available | |
| Mortgage Electronic Registration Systems | $14,400 | None Available | |
| Mnayarji Joyce | $70,000 | Tri County Title Agency Inc | |
| Ace Industries Llc | $22,000 | Tri County Title Agency Inc | |
| Arteaga Sufanita | $22,500 | -- |
Source: Public Records
Tax History Compared to Growth
Tax History
| Year | Tax Paid | Tax Assessment Tax Assessment Total Assessment is a certain percentage of the fair market value that is determined by local assessors to be the total taxable value of land and additions on the property. | Land | Improvement |
|---|---|---|---|---|
| 2025 | $422 | $4,900 | $0 | $0 |
| 2024 | $422 | $3,300 | $0 | $0 |
| 2023 | $407 | $2,800 | $0 | $0 |
| 2022 | $516 | $7,600 | $0 | $0 |
| 2021 | $698 | $5,015 | $0 | $0 |
| 2020 | $504 | $5,200 | $0 | $0 |
| 2019 | $499 | $3,780 | $0 | $0 |
| 2018 | $452 | $3,600 | $0 | $0 |
| 2017 | $68 | $3,600 | $0 | $0 |
| 2016 | $672 | $7,200 | $0 | $0 |
| 2015 | $720 | $7,200 | $0 | $0 |
| 2013 | $1,006 | $10,059 | $0 | $0 |
| 2010 | -- | $14,412 | $803 | $13,609 |
Source: Public Records
Map
Nearby Homes
- 16195 Robson St
- 16241 Robson St
- 15909 Lauder St
- 15918 Sussex St
- 16546 Sussex St
- 15872 Coyle St
- 15900 Lauder St
- 16260 Marlowe St
- 15836 Coyle St
- 16540 Marlowe St
- 15808 Coyle St
- 15909 Hubbell St
- 16656 Robson St
- 16253 Strathmoor St
- 15760 Lauder St
- 15746 Coyle St
- 16246 Strathmoor St
- 16803 Marlowe St
- 15731 Lauder St
- 16171 Mark Twain St
- 16171 Robson St
- 16205 Robson St
- 16179 Robson St
- 16165 Robson St
- 16211 Robson St
- 16176 Coyle St
- 16217 Robson St
- 16170 Coyle St
- 16155 Robson St
- 16210 Coyle St
- 16166 Coyle St
- 16192 Robson St
- 16151 Robson St Unit Bldg-Unit
- 16151 Robson St
- 16225 Robson St
- 16206 Robson St
- 16170 Robson St
- 16220 Coyle St
- 16156 Coyle St
- 16162 Robson St