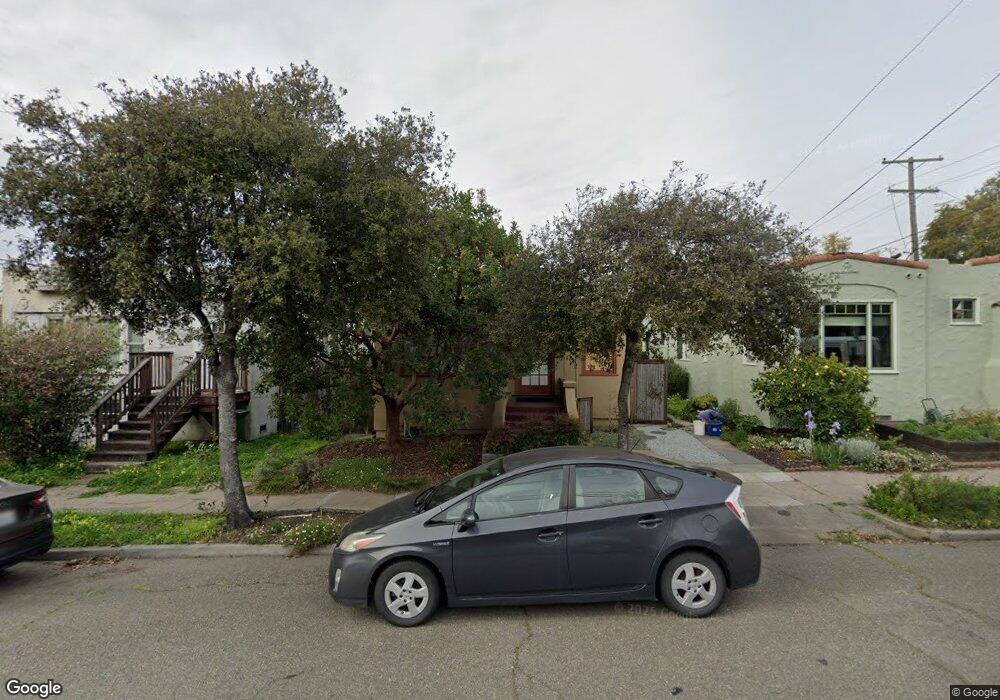
1619 Bancroft Way Berkeley, CA 94703
Downtown Berkeley NeighborhoodEstimated Value: $1,104,209 - $1,217,000
2
Beds
1
Bath
1,199
Sq Ft
$989/Sq Ft
Est. Value
About This Home
This home is located at 1619 Bancroft Way, Berkeley, CA 94703 and is currently estimated at $1,185,552, approximately $988 per square foot. 1619 Bancroft Way is a home located in Alameda County with nearby schools including Washington Elementary School, Oxford Elementary School, and Berkeley Arts Magnet at Whittier School.
Ownership History
Date
Name
Owned For
Owner Type
Purchase Details
Closed on
Dec 26, 2001
Sold by
Douglass Jeffrey and Douglass Romy
Bought by
Nibler Valerie J
Current Estimated Value
Home Financials for this Owner
Home Financials are based on the most recent Mortgage that was taken out on this home.
Original Mortgage
$337,200
Outstanding Balance
$134,753
Interest Rate
6.73%
Estimated Equity
$1,050,799
Purchase Details
Closed on
Mar 28, 1997
Sold by
Saavedra Ralph and Saavedra Rachel
Bought by
Douglass Jeffrey and Douglass Romy
Home Financials for this Owner
Home Financials are based on the most recent Mortgage that was taken out on this home.
Original Mortgage
$169,600
Interest Rate
7.56%
Create a Home Valuation Report for This Property
The Home Valuation Report is an in-depth analysis detailing your home's value as well as a comparison with similar homes in the area
Home Values in the Area
Average Home Value in this Area
Purchase History
| Date | Buyer | Sale Price | Title Company |
|---|---|---|---|
| Nibler Valerie J | $421,500 | Placer Title Company | |
| Douglass Jeffrey | $212,000 | First American Title Guarant |
Source: Public Records
Mortgage History
| Date | Status | Borrower | Loan Amount |
|---|---|---|---|
| Open | Nibler Valerie J | $337,200 | |
| Previous Owner | Douglass Jeffrey | $169,600 | |
| Closed | Nibler Valerie J | $63,200 |
Source: Public Records
Tax History
| Year | Tax Paid | Tax Assessment Tax Assessment Total Assessment is a certain percentage of the fair market value that is determined by local assessors to be the total taxable value of land and additions on the property. | Land | Improvement |
|---|---|---|---|---|
| 2025 | $9,787 | $632,755 | $186,865 | $452,890 |
| 2024 | $9,787 | $620,213 | $183,202 | $444,011 |
| 2023 | $9,582 | $614,918 | $179,611 | $435,307 |
| 2022 | $9,409 | $595,861 | $176,089 | $426,772 |
| 2021 | $9,428 | $584,042 | $172,637 | $418,405 |
| 2020 | $8,928 | $584,983 | $170,867 | $414,116 |
| 2019 | $8,582 | $573,514 | $167,517 | $405,997 |
| 2018 | $8,438 | $562,271 | $164,233 | $398,038 |
| 2017 | $8,128 | $551,250 | $161,014 | $390,236 |
| 2016 | $7,868 | $540,444 | $157,858 | $382,586 |
| 2015 | $7,764 | $532,328 | $155,487 | $376,841 |
| 2014 | $7,710 | $521,903 | $152,442 | $369,461 |
Source: Public Records
Map
Nearby Homes
- 2118 California St
- 2350 Sacramento St
- 1645 Dwight Way
- 2218 -2222 Grant St
- 1612 Parker St
- 1813 Sacramento St
- 1612 Carleton St
- 1411 Hearst Ave Unit 2
- 1901 Parker St Unit 3
- 1436 Delaware St
- 1515 Derby St
- 2324 Browning St
- 2701 Grant St
- 2018 Blake St
- 2144 Curtis St
- 2231 Byron St
- 2750 Sacramento St
- 1450 Ward St
- 2758 Sacramento St
- 1142 Dwight Way
- 1617 Bancroft Way
- 1621 Bancroft Way
- 2234 Jefferson Ave
- 1609 Bancroft Way
- 2232 Jefferson Ave
- 1628 Bancroft Way
- 1605 Bancroft Way
- 2237 California St
- 2304 Jefferson Ave
- 1631 Bancroft Way
- 1608 Bancroft Way
- 2241 Jefferson Ave
- 2235 California St
- 2237 Jefferson Ave
- 2228 Jefferson Ave
- 1601 Bancroft Way
- 1606 Bancroft Way
- 2306 Jefferson Ave
- 2233 California St
- 1604 Bancroft Way
Your Personal Tour Guide
Ask me questions while you tour the home.