1619 D Ave New Castle, IN 47362
New Castle NeighborhoodEstimated Value: $54,000
2
Beds
1
Bath
972
Sq Ft
$56/Sq Ft
Est. Value
About This Home
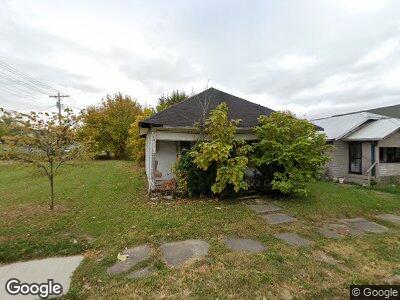
This home is located at 1619 D Ave, New Castle, IN 47362 and is currently priced at $54,000, approximately $55 per square foot. 1619 D Ave is a home located in Henry County with nearby schools including Agape Learning Center.
Ownership History
Date
Name
Owned For
Owner Type
Purchase Details
Closed on
Dec 28, 2018
Sold by
Roy Brandenburg and Brandenburg Tony
Bought by
The City Of New Castle
Current Estimated Value
Purchase Details
Closed on
Aug 5, 2011
Sold by
Davis Claude E and Davis Patricia
Bought by
Brandenburg Roy and Brandenbeurg Tony L
Purchase Details
Closed on
Oct 6, 2007
Sold by
Davis Claude E and Davis Patricia
Bought by
Brandenburg Roy
Home Financials for this Owner
Home Financials are based on the most recent Mortgage that was taken out on this home.
Original Mortgage
$19,000
Interest Rate
8%
Mortgage Type
Seller Take Back
Create a Home Valuation Report for This Property
The Home Valuation Report is an in-depth analysis detailing your home's value as well as a comparison with similar homes in the area
Home Values in the Area
Average Home Value in this Area
Purchase History
| Date | Buyer | Sale Price | Title Company |
|---|---|---|---|
| The City Of New Castle | -- | None Available | |
| Brandenburg Roy | -- | None Available | |
| Brandenburg Roy | $19,000 | None Available |
Source: Public Records
Mortgage History
| Date | Status | Borrower | Loan Amount |
|---|---|---|---|
| Previous Owner | Brandenburg Roy | $19,000 |
Source: Public Records
Tax History Compared to Growth
Tax History
| Year | Tax Paid | Tax Assessment Tax Assessment Total Assessment is a certain percentage of the fair market value that is determined by local assessors to be the total taxable value of land and additions on the property. | Land | Improvement |
|---|---|---|---|---|
| 2024 | $540 | $18,000 | $18,000 | $0 |
| 2023 | -- | $0 | $0 | $0 |
| 2022 | $0 | $0 | $0 | $0 |
| 2021 | $0 | $0 | $0 | $0 |
| 2020 | $12 | $0 | $0 | $0 |
| 2019 | $49 | $8,400 | $6,000 | $2,400 |
| 2018 | $723 | $16,900 | $5,400 | $11,500 |
| 2017 | $416 | $16,700 | $5,400 | $11,300 |
| 2016 | $390 | $19,600 | $6,400 | $13,200 |
| 2014 | $170 | $21,100 | $7,900 | $13,200 |
| 2013 | $170 | $20,500 | $7,900 | $12,600 |
Source: Public Records
Map
Nearby Homes