1619 E 42nd St Kansas City, MO 64110
Ivanhoe Southwest NeighborhoodEstimated Value: $279,000 - $338,000
3
Beds
1
Bath
822
Sq Ft
$376/Sq Ft
Est. Value
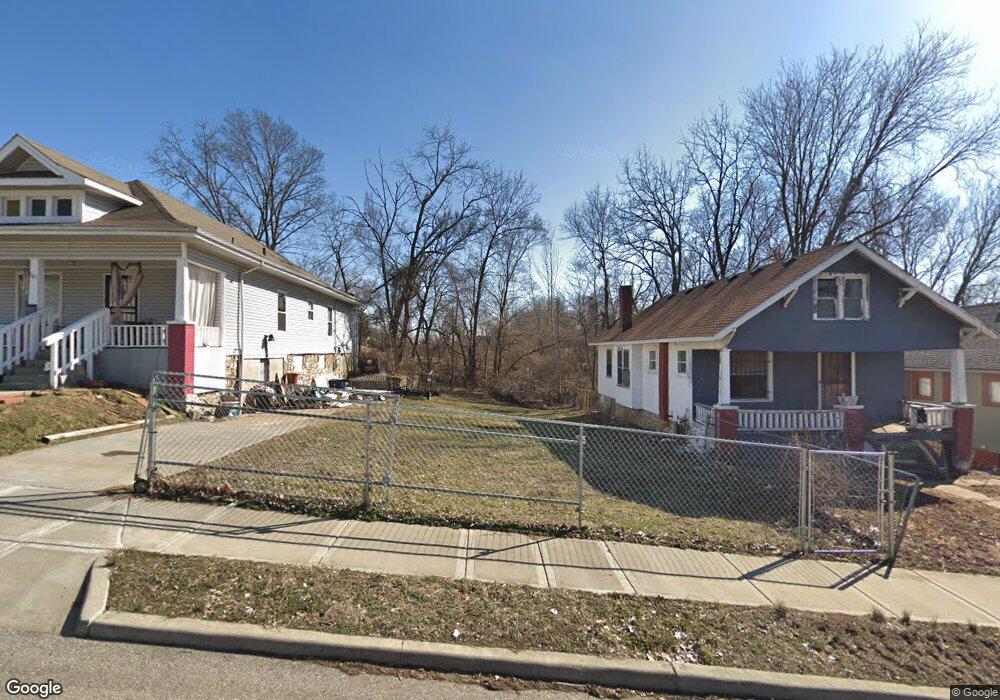
About This Home
This home is located at 1619 E 42nd St, Kansas City, MO 64110 and is currently estimated at $309,000, approximately $375 per square foot. 1619 E 42nd St is a home located in Jackson County with nearby schools including M. L. King Elementary School, Central Middle School, and Central High School.
Ownership History
Date
Name
Owned For
Owner Type
Purchase Details
Closed on
Oct 16, 2015
Sold by
Kansas City Missouri Homesteading Author
Bought by
Fuqua Fred E and Fuqua Virgilene
Current Estimated Value
Purchase Details
Closed on
Sep 19, 2012
Sold by
The Land Trust
Bought by
Missouri Homesteading Authority
Purchase Details
Closed on
Feb 22, 2007
Sold by
Wright Vinitta
Bought by
Wells Fargo Bank Na
Purchase Details
Closed on
Nov 2, 2004
Sold by
Brown Tora
Bought by
Wright Vinitta
Home Financials for this Owner
Home Financials are based on the most recent Mortgage that was taken out on this home.
Original Mortgage
$54,000
Interest Rate
7.85%
Mortgage Type
Purchase Money Mortgage
Purchase Details
Closed on
Oct 5, 2004
Sold by
Wright Vinitta
Bought by
Hall Larry
Home Financials for this Owner
Home Financials are based on the most recent Mortgage that was taken out on this home.
Original Mortgage
$54,000
Interest Rate
7.85%
Mortgage Type
Purchase Money Mortgage
Create a Home Valuation Report for This Property
The Home Valuation Report is an in-depth analysis detailing your home's value as well as a comparison with similar homes in the area
Home Values in the Area
Average Home Value in this Area
Purchase History
| Date | Buyer | Sale Price | Title Company |
|---|---|---|---|
| Fuqua Fred E | -- | None Available | |
| Missouri Homesteading Authority | -- | None Available | |
| Wells Fargo Bank Na | $42,925 | None Available | |
| Wright Vinitta | -- | Universal Title | |
| Hall Larry | -- | -- |
Source: Public Records
Mortgage History
| Date | Status | Borrower | Loan Amount |
|---|---|---|---|
| Previous Owner | Wright Vinitta | $54,000 | |
| Closed | Fuqua Fred E | $0 |
Source: Public Records
Tax History Compared to Growth
Tax History
| Year | Tax Paid | Tax Assessment Tax Assessment Total Assessment is a certain percentage of the fair market value that is determined by local assessors to be the total taxable value of land and additions on the property. | Land | Improvement |
|---|---|---|---|---|
| 2025 | $146 | $1,853 | $1,853 | -- |
| 2024 | $145 | $1,853 | $1,853 | -- |
| 2023 | $145 | $1,853 | $1,853 | $0 |
| 2022 | $117 | $1,425 | $1,425 | $0 |
| 2021 | $117 | $1,425 | $1,425 | $0 |
| 2020 | $116 | $1,397 | $1,397 | $0 |
| 2019 | $114 | $1,397 | $1,397 | $0 |
| 2018 | $3 | $39 | $39 | $0 |
| 2017 | $3 | $39 | $39 | $0 |
| 2016 | $3 | $38 | $38 | $0 |
| 2014 | -- | $673 | $283 | $390 |
Source: Public Records
Map
Nearby Homes
- 4139 Flora Ave
- 4121 Woodland Ave
- 4241 Paseo Blvd
- 4200 Paseo Blvd
- 4023 Highland Ave
- 4231 Euclid Ave
- 4005 Highland Ave
- 4314 Paseo Blvd
- 4135 Garfield Ave
- 4428 Wayne Ave
- 4327 Garfield Ave
- 4000 Garfield Ave
- 3915 Highland Ave
- 3924 Brooklyn Ave
- 4117 Forest Ave
- 3905 Highland Ave
- 3902 Highland Ave
- 3929 Euclid Ave
- 2208 E 43rd St
- Washington Plan at KC Scattered
- 1621 E 42nd St
- 1617 E 42nd St
- 1615 E 42nd St
- 1611 E 42nd St
- 4201 Highland Ave
- 4205 Highland Ave
- 1614 E 42nd St
- 1616 E 42nd St
- 1618 E 42nd St
- 1607 E 42nd St
- 1610 E 42nd St
- 4207 Highland Ave
- 1608 E 42nd St
- 1603 E 42nd St
- 4145 Highland Ave
- 1606 E 42nd St
- 4211 Highland Ave
- 1604 E 42nd St
- 4209 Wayne Ave
- 4140 Highland Ave