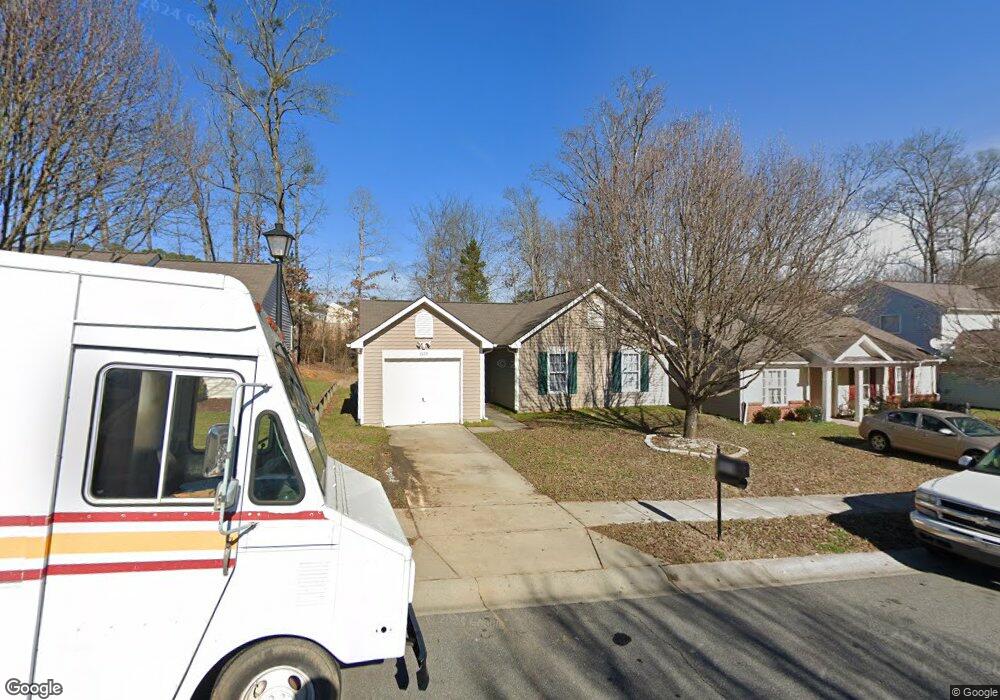
1619 Flagler Ln Charlotte, NC 28216
Oakdale NeighborhoodEstimated Value: $271,869 - $302,000
3
Beds
2
Baths
1,157
Sq Ft
$245/Sq Ft
Est. Value
About This Home
This home is located at 1619 Flagler Ln, Charlotte, NC 28216 and is currently estimated at $283,217, approximately $244 per square foot. 1619 Flagler Ln is a home located in Mecklenburg County with nearby schools including Oakdale Elementary School, Ranson Middle School, and West Charlotte High School.
Ownership History
Date
Name
Owned For
Owner Type
Purchase Details
Closed on
Mar 16, 2011
Sold by
Secretary Of Housing & Urban Development
Bought by
Kingbridge Holdings Llc
Current Estimated Value
Purchase Details
Closed on
Dec 17, 2010
Sold by
Wells Fargo Bank Na
Bought by
Secretary Of Housing & Urban Development
Purchase Details
Closed on
Dec 2, 2010
Sold by
Neal Kimberly P
Bought by
Wells Fargo Bank Na
Purchase Details
Closed on
Dec 12, 2003
Sold by
Eastwood Construction Co Inc
Bought by
Neal Kimberly P
Home Financials for this Owner
Home Financials are based on the most recent Mortgage that was taken out on this home.
Original Mortgage
$116,176
Interest Rate
5.98%
Mortgage Type
FHA
Purchase Details
Closed on
Mar 28, 2003
Sold by
Pinebrook Llc
Bought by
Eastwood Construction Co Inc and Eastwood Homes
Create a Home Valuation Report for This Property
The Home Valuation Report is an in-depth analysis detailing your home's value as well as a comparison with similar homes in the area
Home Values in the Area
Average Home Value in this Area
Purchase History
| Date | Buyer | Sale Price | Title Company |
|---|---|---|---|
| Kingbridge Holdings Llc | -- | None Available | |
| Secretary Of Housing & Urban Development | -- | None Available | |
| Wells Fargo Bank Na | $126,049 | None Available | |
| Neal Kimberly P | $118,000 | -- | |
| Eastwood Construction Co Inc | $94,500 | -- |
Source: Public Records
Mortgage History
| Date | Status | Borrower | Loan Amount |
|---|---|---|---|
| Previous Owner | Neal Kimberly P | $116,176 |
Source: Public Records
Tax History Compared to Growth
Tax History
| Year | Tax Paid | Tax Assessment Tax Assessment Total Assessment is a certain percentage of the fair market value that is determined by local assessors to be the total taxable value of land and additions on the property. | Land | Improvement |
|---|---|---|---|---|
| 2025 | -- | $256,000 | $60,000 | $196,000 |
| 2024 | -- | $256,000 | $60,000 | $196,000 |
| 2023 | $1,302 | $256,000 | $60,000 | $196,000 |
| 2022 | $1,302 | $134,900 | $20,000 | $114,900 |
| 2021 | $1,302 | $134,900 | $20,000 | $114,900 |
| 2020 | $1,302 | $134,900 | $20,000 | $114,900 |
| 2019 | $1,393 | $134,900 | $20,000 | $114,900 |
| 2018 | $917 | $64,300 | $12,000 | $52,300 |
| 2017 | $895 | $64,300 | $12,000 | $52,300 |
| 2016 | $886 | $64,300 | $12,000 | $52,300 |
| 2015 | $874 | $64,300 | $12,000 | $52,300 |
| 2014 | $888 | $64,300 | $12,000 | $52,300 |
Source: Public Records
Map
Nearby Homes
- 1623 Flagler Ln
- 1523 Hollow Maple Dr
- 1626 Oakdale Green Dr
- 1326 Majestic Meadow Dr
- 1500 Majestic Meadow Dr
- 6708 Burning Oak Ln
- 1711 Dunnington Ct
- 6420 Sunman Rd
- 836 Almora Dr
- 6411 Pleasant Grove Rd
- 6042 Crape Myrtle Ln
- 2515 Walnut Forest Dr
- 1325 Leolillie Ln
- 820 Dale Ave
- 1134 Keydet Dr
- 2313 Lazette Dr
- 1206 Keydet Dr
- 1331 Braveheart Ln
- 1421 Thompson Ave
- 7325 Larwill Ln
- 1615 Flagler Ln
- 1627 Flagler Ln
- 1611 Flagler Ln
- 1631 Flagler Ln
- 6812 Sunman Rd
- 1607 Flagler Ln
- 1616 Flagler Ln
- 6818 Sunman Rd
- 1635 Flagler Ln
- 1122 Rolette Ct
- 6824 Sunman Rd
- 1115 Rolette Ct
- 1639 Flagler Ln
- 1116 Rolette Ct
- 6830 Sunman Rd
- 1539 Flagler Ln
- 6817 Sunman Rd
- 1111 Rolette Ct
- 6713 Commack Dr
- 1643 Flagler Ln