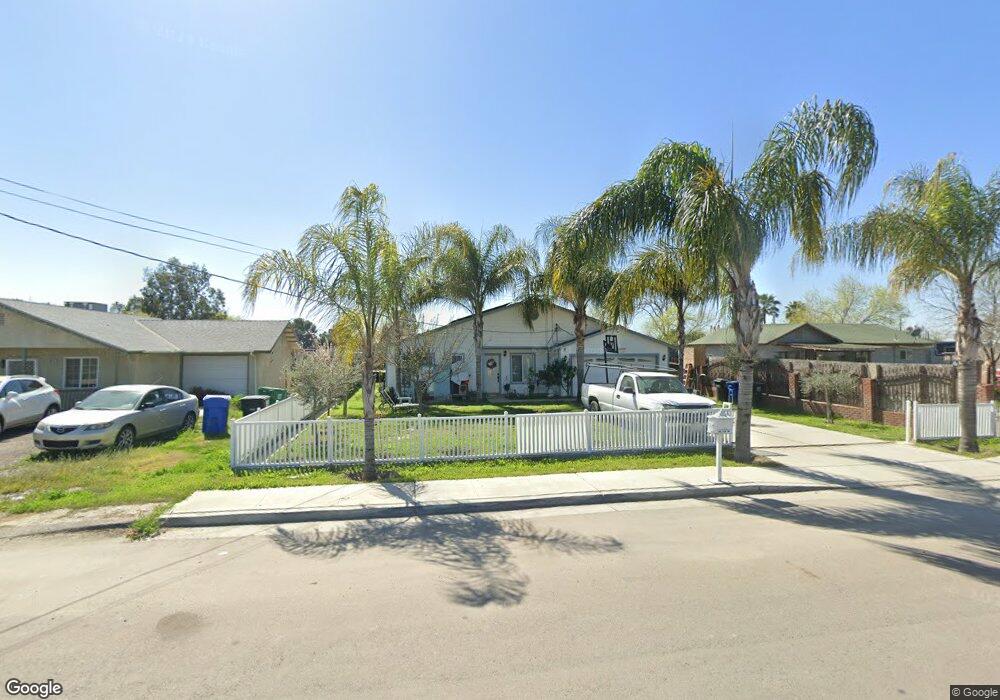
1619 Osage Ave Corcoran, CA 93212
Estimated Value: $237,000 - $264,000
3
Beds
1
Bath
1,071
Sq Ft
$234/Sq Ft
Est. Value
About This Home
This home is located at 1619 Osage Ave, Corcoran, CA 93212 and is currently estimated at $250,253, approximately $233 per square foot. 1619 Osage Ave is a home located in Kings County with nearby schools including Mark Twain Elementary School, Bret Harte Elementary School, and John C. Fremont Elementary School.
Ownership History
Date
Name
Owned For
Owner Type
Purchase Details
Closed on
Jun 1, 2006
Sold by
Panduro Teresa
Bought by
Pelayo Daniel and Pelayo Brenda
Current Estimated Value
Purchase Details
Closed on
Sep 29, 2002
Sold by
Panduro Teresa
Bought by
Panduro Teresa and Pelayo Brenda
Purchase Details
Closed on
Nov 7, 2001
Sold by
Sabalza Samuel Panduro and Gonzalez Leonor Panduro
Bought by
Panduro Teresa
Purchase Details
Closed on
Sep 15, 1999
Sold by
Brewer Leslie F Living Trust
Bought by
Sabalza Samuel Panduro and Gonzalez Leonor Panduro
Home Financials for this Owner
Home Financials are based on the most recent Mortgage that was taken out on this home.
Original Mortgage
$25,000
Interest Rate
7.97%
Mortgage Type
Seller Take Back
Create a Home Valuation Report for This Property
The Home Valuation Report is an in-depth analysis detailing your home's value as well as a comparison with similar homes in the area
Home Values in the Area
Average Home Value in this Area
Purchase History
| Date | Buyer | Sale Price | Title Company |
|---|---|---|---|
| Pelayo Daniel | -- | None Available | |
| Panduro Teresa | -- | -- | |
| Panduro Teresa | -- | First American Title Co | |
| Sabalza Samuel Panduro | $25,000 | First American Title |
Source: Public Records
Mortgage History
| Date | Status | Borrower | Loan Amount |
|---|---|---|---|
| Previous Owner | Sabalza Samuel Panduro | $25,000 |
Source: Public Records
Tax History Compared to Growth
Tax History
| Year | Tax Paid | Tax Assessment Tax Assessment Total Assessment is a certain percentage of the fair market value that is determined by local assessors to be the total taxable value of land and additions on the property. | Land | Improvement |
|---|---|---|---|---|
| 2025 | $1,478 | $149,465 | $17,724 | $131,741 |
| 2023 | $1,478 | $143,663 | $17,037 | $126,626 |
| 2022 | $1,427 | $140,847 | $16,703 | $124,144 |
| 2021 | $1,398 | $138,086 | $16,376 | $121,710 |
| 2020 | $1,375 | $136,670 | $16,208 | $120,462 |
| 2019 | $1,558 | $133,990 | $15,890 | $118,100 |
| 2018 | $1,536 | $131,362 | $15,578 | $115,784 |
| 2017 | $1,504 | $128,787 | $15,273 | $113,514 |
| 2016 | $1,289 | $126,262 | $14,974 | $111,288 |
| 2015 | $1,286 | $124,365 | $14,749 | $109,616 |
| 2014 | $1,263 | $121,929 | $14,460 | $107,469 |
Source: Public Records
Map
Nearby Homes
- 1615 Osage Ave
- 1609 Brewer Ave
- 1530 Ottawa Ave
- 1931 Dairy Ave
- 0 S Dairy Ave
- 1851 van Dorsten Ave
- 1801 Hale Ave
- 1728 Estes Ave
- 1717 Letts Ave
- 1732 Hume Lake Ave
- 1720 Hume Lake Ave
- 1708 Hume Lake Ave
- 1657 Sequoia Ave
- 1509 Letts Ave
- The Santa Cruz Plan at The Sequoias
- The Monterey Plan at The Sequoias
- The Condessa Plan at The Sequoias
- The Argent Plan at The Sequoias
- The Fasano Plan at The Sequoias
- 1425 Letts Ave
- 798 N Star Dr
- 1621 Osage Ave
- 1609 Osage Ave
- 1630 Brewer Ave
- 1656 Brewer Ave
- 1620 Osage Ave
- 1700 Brewer Ave
- 1702 Osage Ave
- 2118 Letts Ave
- 1603 Osage Ave
- 0 Brewer Ave
- 1702 Brewer Ave
- 2019 Estes Ave
- 2120 Letts Ave
- 1712 Brewer Ave
- 1711 Osage Ave
- 1525 Osage Ave
- 1704 Osage Ave
- 2121 Letts Ave
- 2119 Letts Ave