1619 Tyler St Berkeley, CA 94703
South Berkeley NeighborhoodEstimated Value: $953,000 - $1,057,961
3
Beds
1
Bath
1,283
Sq Ft
$782/Sq Ft
Est. Value
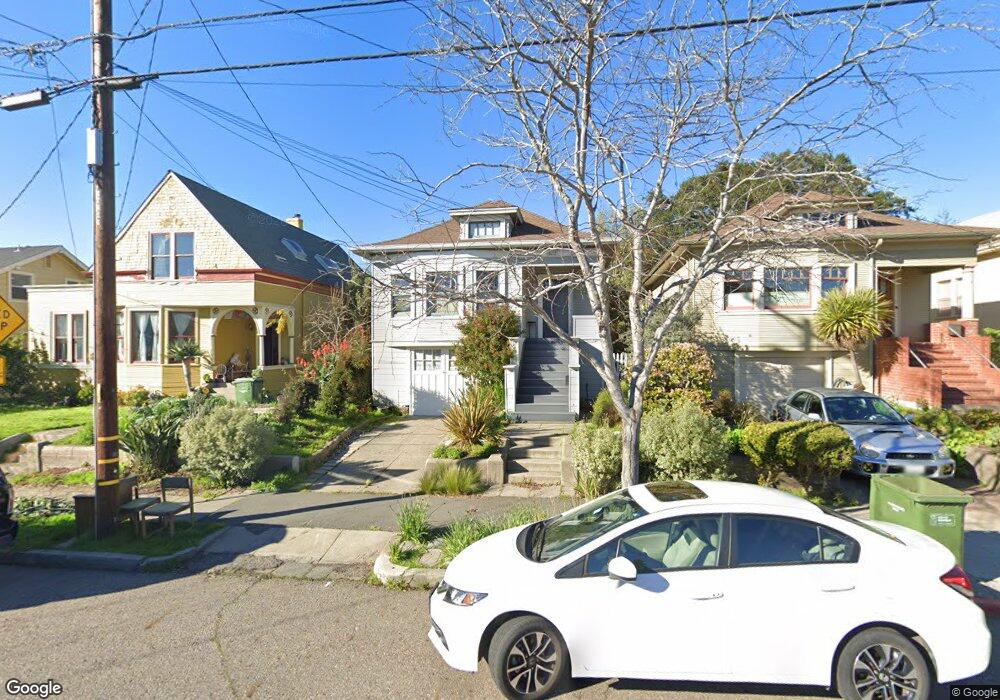
About This Home
This home is located at 1619 Tyler St, Berkeley, CA 94703 and is currently estimated at $1,003,490, approximately $782 per square foot. 1619 Tyler St is a home located in Alameda County with nearby schools including Malcolm X Elementary School, Emerson Elementary School, and John Muir Elementary School.
Ownership History
Date
Name
Owned For
Owner Type
Purchase Details
Closed on
Jan 31, 2005
Sold by
Ripperda Mark Allen
Bought by
Wells Janet Alison and Ripperda Mark Allen
Current Estimated Value
Purchase Details
Closed on
May 14, 2002
Sold by
Wells Janet
Bought by
Ripperda Mark Allen
Home Financials for this Owner
Home Financials are based on the most recent Mortgage that was taken out on this home.
Original Mortgage
$150,000
Interest Rate
6.94%
Purchase Details
Closed on
Jul 22, 1997
Sold by
Garmhausen James H and Peters Rebecca A
Bought by
Ripperda Mark Allen
Home Financials for this Owner
Home Financials are based on the most recent Mortgage that was taken out on this home.
Original Mortgage
$152,800
Interest Rate
7.7%
Mortgage Type
Balloon
Create a Home Valuation Report for This Property
The Home Valuation Report is an in-depth analysis detailing your home's value as well as a comparison with similar homes in the area
Home Values in the Area
Average Home Value in this Area
Purchase History
| Date | Buyer | Sale Price | Title Company |
|---|---|---|---|
| Wells Janet Alison | -- | -- | |
| Ripperda Mark Allen | -- | First American Title | |
| Ripperda Mark Allen | $191,000 | Nortwestern Title Company |
Source: Public Records
Mortgage History
| Date | Status | Borrower | Loan Amount |
|---|---|---|---|
| Closed | Ripperda Mark Allen | $150,000 | |
| Closed | Ripperda Mark Allen | $152,800 |
Source: Public Records
Tax History
| Year | Tax Paid | Tax Assessment Tax Assessment Total Assessment is a certain percentage of the fair market value that is determined by local assessors to be the total taxable value of land and additions on the property. | Land | Improvement |
|---|---|---|---|---|
| 2025 | $8,005 | $303,650 | $91,489 | $219,161 |
| 2024 | $8,005 | $297,559 | $89,695 | $214,864 |
| 2023 | $7,746 | $298,589 | $87,937 | $210,652 |
| 2022 | $7,471 | $285,735 | $86,213 | $206,522 |
| 2021 | $7,442 | $279,995 | $84,522 | $202,473 |
| 2020 | $6,880 | $284,053 | $83,656 | $200,397 |
| 2019 | $6,427 | $278,485 | $82,016 | $196,469 |
| 2018 | $6,270 | $273,025 | $80,408 | $192,617 |
| 2017 | $6,039 | $267,673 | $78,832 | $188,841 |
| 2016 | $5,880 | $262,425 | $77,286 | $185,139 |
| 2015 | $5,774 | $258,483 | $76,125 | $182,358 |
| 2014 | $5,673 | $253,421 | $74,634 | $178,787 |
Source: Public Records
Map
Nearby Homes
- 1646 Ashby Ave
- 1535 Julia St
- 2926 Ellis St
- 3110 California St
- 3114 California St
- 1507 Prince St
- 3101 Sacramento St
- 3138 California St
- 2922 Stanton St
- 1530 Stuart St
- 3214 California St
- 3233 Ellis St
- 2790 Sacramento St
- 2782 Sacramento St
- 2727 McGee Ave
- 2774 Sacramento St
- 3224 Sacramento St
- 2758 Sacramento St
- 2750 Sacramento St
- 1450 Ward St
Your Personal Tour Guide
Ask me questions while you tour the home.