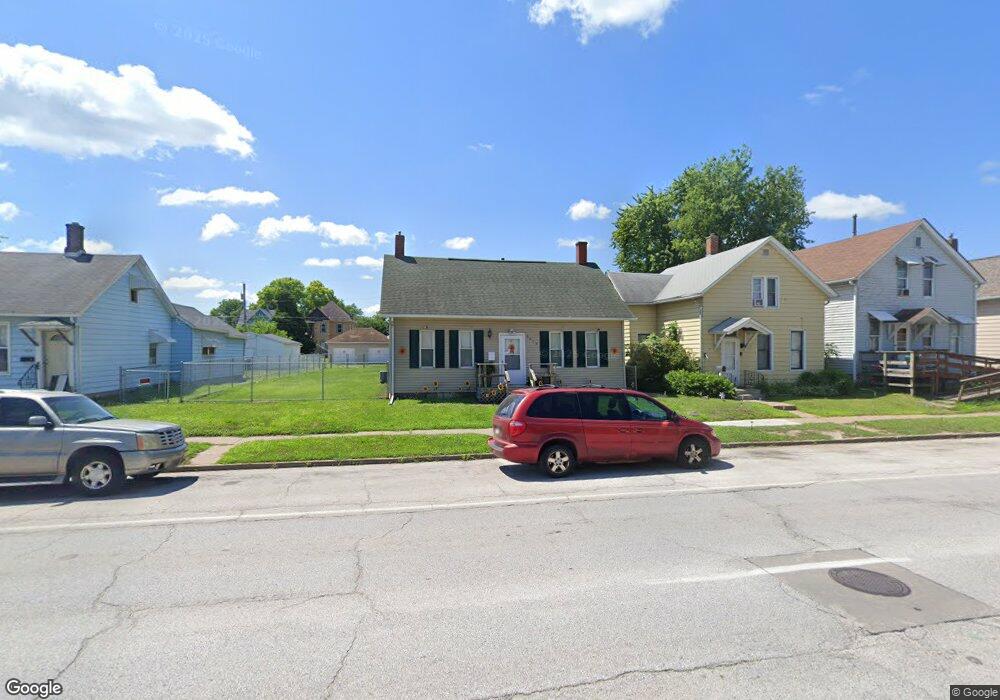
1619 W 4th St Davenport, IA 52802
Downtown Davenport NeighborhoodEstimated Value: $84,000 - $113,381
2
Beds
2
Baths
1,312
Sq Ft
$80/Sq Ft
Est. Value
About This Home
This home is located at 1619 W 4th St, Davenport, IA 52802 and is currently estimated at $105,345, approximately $80 per square foot. 1619 W 4th St is a home located in Scott County with nearby schools including Walnut Hill Elementary School, South Christian Elementary School, and Christian County Middle School.
Ownership History
Date
Name
Owned For
Owner Type
Purchase Details
Closed on
Sep 29, 2009
Sold by
Dodson Damarrol M
Bought by
Barnhart Neia N
Current Estimated Value
Home Financials for this Owner
Home Financials are based on the most recent Mortgage that was taken out on this home.
Original Mortgage
$58,814
Outstanding Balance
$38,464
Interest Rate
5.19%
Mortgage Type
FHA
Estimated Equity
$66,881
Purchase Details
Closed on
Jun 9, 2009
Sold by
Northwest Bank & Trust
Bought by
White Brian T
Home Financials for this Owner
Home Financials are based on the most recent Mortgage that was taken out on this home.
Original Mortgage
$53,200
Interest Rate
4.92%
Mortgage Type
Future Advance Clause Open End Mortgage
Purchase Details
Closed on
Sep 6, 2005
Sold by
Brandon Beverly J
Bought by
Murtaza Jim and Mirtaza Aileen R
Create a Home Valuation Report for This Property
The Home Valuation Report is an in-depth analysis detailing your home's value as well as a comparison with similar homes in the area
Home Values in the Area
Average Home Value in this Area
Purchase History
| Date | Buyer | Sale Price | Title Company |
|---|---|---|---|
| Barnhart Neia N | -- | None Available | |
| Barnhart Neia N | $60,000 | None Available | |
| White Brian T | $33,500 | None Available | |
| Murtaza Jim | $20,000 | None Available |
Source: Public Records
Mortgage History
| Date | Status | Borrower | Loan Amount |
|---|---|---|---|
| Open | Barnhart Neia N | $58,814 | |
| Previous Owner | White Brian T | $53,200 |
Source: Public Records
Tax History Compared to Growth
Tax History
| Year | Tax Paid | Tax Assessment Tax Assessment Total Assessment is a certain percentage of the fair market value that is determined by local assessors to be the total taxable value of land and additions on the property. | Land | Improvement |
|---|---|---|---|---|
| 2025 | $1,302 | $101,860 | $7,850 | $94,010 |
| 2024 | $1,266 | $83,060 | $7,850 | $75,210 |
| 2023 | $1,668 | $83,060 | $7,850 | $75,210 |
| 2022 | $1,674 | $86,960 | $7,850 | $79,110 |
| 2021 | $1,674 | $86,960 | $7,850 | $79,110 |
| 2020 | $1,710 | $80,080 | $7,850 | $72,230 |
| 2019 | $2,112 | $73,200 | $7,850 | $65,350 |
| 2018 | $1,117 | $73,200 | $7,850 | $65,350 |
| 2017 | $388 | $69,760 | $7,850 | $61,910 |
| 2016 | $1,548 | $66,320 | $0 | $0 |
| 2015 | $1,262 | $56,940 | $0 | $0 |
| 2014 | $1,072 | $56,940 | $0 | $0 |
| 2013 | $1,048 | $0 | $0 | $0 |
| 2012 | -- | $49,280 | $7,940 | $41,340 |
Source: Public Records
Map
Nearby Homes