162 Cumberland Rd Griffin, GA 30224
Spalding County NeighborhoodEstimated Value: $252,298 - $309,000
3
Beds
2
Baths
1,610
Sq Ft
$177/Sq Ft
Est. Value
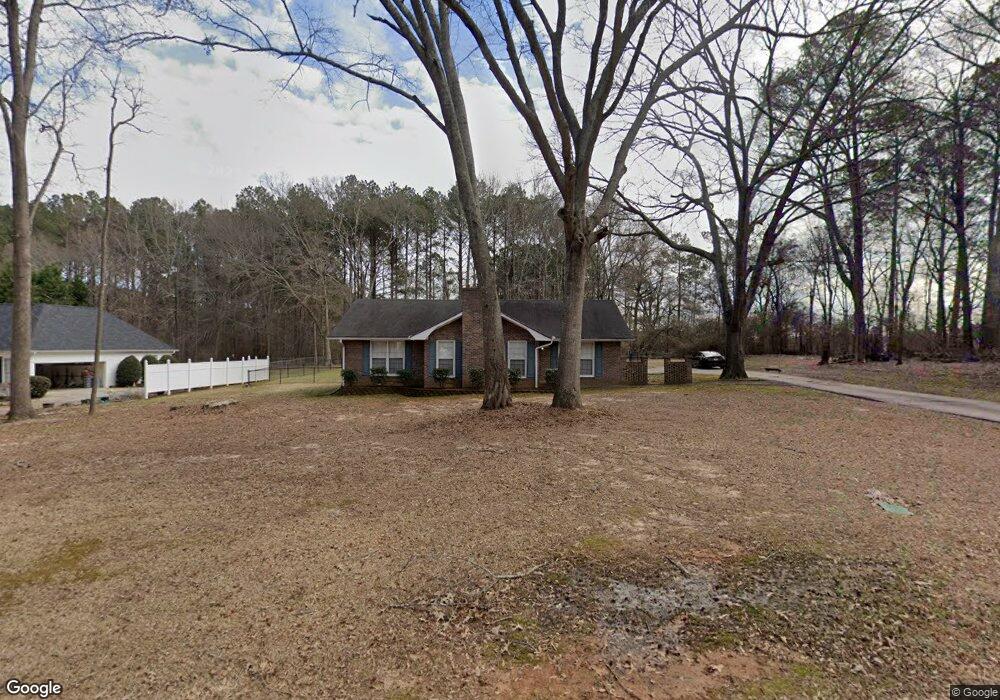
About This Home
This home is located at 162 Cumberland Rd, Griffin, GA 30224 and is currently estimated at $284,575, approximately $176 per square foot. 162 Cumberland Rd is a home located in Spalding County with nearby schools including Crescent Road Elementary School, Rehoboth Road Middle School, and Spalding High School.
Ownership History
Date
Name
Owned For
Owner Type
Purchase Details
Closed on
Jun 10, 2019
Sold by
Atchison Jon R
Bought by
Atchison Jon R and Raines Tiffany Michelle
Current Estimated Value
Home Financials for this Owner
Home Financials are based on the most recent Mortgage that was taken out on this home.
Original Mortgage
$162,011
Outstanding Balance
$142,447
Interest Rate
4.1%
Mortgage Type
FHA
Estimated Equity
$142,128
Purchase Details
Closed on
Feb 24, 2017
Sold by
Pryor Tonya Leigh
Bought by
Pryor Chris Griffin
Purchase Details
Closed on
Jun 8, 1992
Sold by
Morgan Lauren M
Bought by
Runyans Bobby D and Runyans Joyce F
Purchase Details
Closed on
Aug 7, 1989
Sold by
Moore Kenneth M and Moore Shirley P
Bought by
Morgan Lauren M
Purchase Details
Closed on
Jul 10, 1979
Sold by
Pruitt Elizabeth
Bought by
Moore Kenneth M and Moore Shirley P
Purchase Details
Closed on
Sep 29, 1976
Sold by
Carlisle John R
Bought by
Pruitt Elizabeth
Create a Home Valuation Report for This Property
The Home Valuation Report is an in-depth analysis detailing your home's value as well as a comparison with similar homes in the area
Home Values in the Area
Average Home Value in this Area
Purchase History
| Date | Buyer | Sale Price | Title Company |
|---|---|---|---|
| Atchison Jon R | -- | -- | |
| Atchison Jon R | $165,000 | -- | |
| Pryor Chris Griffin | -- | -- | |
| Runyans Bobby D | $67,000 | -- | |
| Morgan Lauren M | $71,500 | -- | |
| Moore Kenneth M | -- | -- | |
| Pruitt Elizabeth | $9,000 | -- |
Source: Public Records
Mortgage History
| Date | Status | Borrower | Loan Amount |
|---|---|---|---|
| Open | Atchison Jon R | $162,011 | |
| Closed | Atchison Jon R | $162,011 |
Source: Public Records
Tax History Compared to Growth
Tax History
| Year | Tax Paid | Tax Assessment Tax Assessment Total Assessment is a certain percentage of the fair market value that is determined by local assessors to be the total taxable value of land and additions on the property. | Land | Improvement |
|---|---|---|---|---|
| 2024 | $2,816 | $78,709 | $11,200 | $67,509 |
| 2023 | $2,816 | $78,709 | $11,200 | $67,509 |
| 2022 | $2,083 | $59,093 | $10,000 | $49,093 |
| 2021 | $1,852 | $52,745 | $10,000 | $42,745 |
| 2020 | $1,672 | $47,624 | $10,000 | $37,624 |
| 2019 | $1,600 | $42,973 | $10,000 | $32,973 |
| 2018 | $1,617 | $42,319 | $10,000 | $32,319 |
| 2017 | $1,573 | $42,154 | $10,000 | $32,154 |
| 2016 | $1,565 | $41,364 | $10,000 | $31,364 |
| 2015 | $1,612 | $41,364 | $10,000 | $31,364 |
| 2014 | $1,644 | $41,364 | $10,000 | $31,364 |
Source: Public Records
Map
Nearby Homes
- 174 Grange Rd
- 3000 Ext S 6th St
- 137 Townsend Ct
- 131 Townsend Ct
- 2002 Millstream Ct
- 2000 Millstream Ct
- 1011 Waverly Dr
- 1013 Waverly Dr
- 133 Four Oaks Dr
- LOT 48 Waverly Dr Unit 1
- LOT 47 Waverly Dr Unit 1
- LOT 69 Waverly Dr Unit 1
- LOT 68 Waverly Dr Unit 1
- LOT 67 Waverly Dr Unit 1
- LOT 66 Waverly Dr Unit 1
- LOT 65 Waverly Dr Unit 1
- LOT 46 Waverly Dr Unit 1
- LOT 45 Waverly Dr Unit 1
- LOT 44 Waverly Dr Unit 1
- LOT 43 Waverly Dr Unit 1
- 166 Cumberland Rd
- 158 Cumberland Rd
- 151 Cumberland Rd
- 1186 Cumberland Rd
- 1210 Cumberland Rd
- 154 Cumberland Rd
- 169 Cumberland Rd
- 1170 Cumberland Rd
- 143 Cumberland Rd
- 173 Cumberland Rd
- 146 Cumberland Rd
- 137 Cumberland Rd
- 180 Grange Rd
- 0 Grange Rd Unit 8404521
- 0 Grange Rd Unit 8084311
- 0 Grange Rd
- 133 Cumberland Rd
- 183 Cumberland Rd
- 176 Grange Rd
- 176 Grange Rd Unit 25