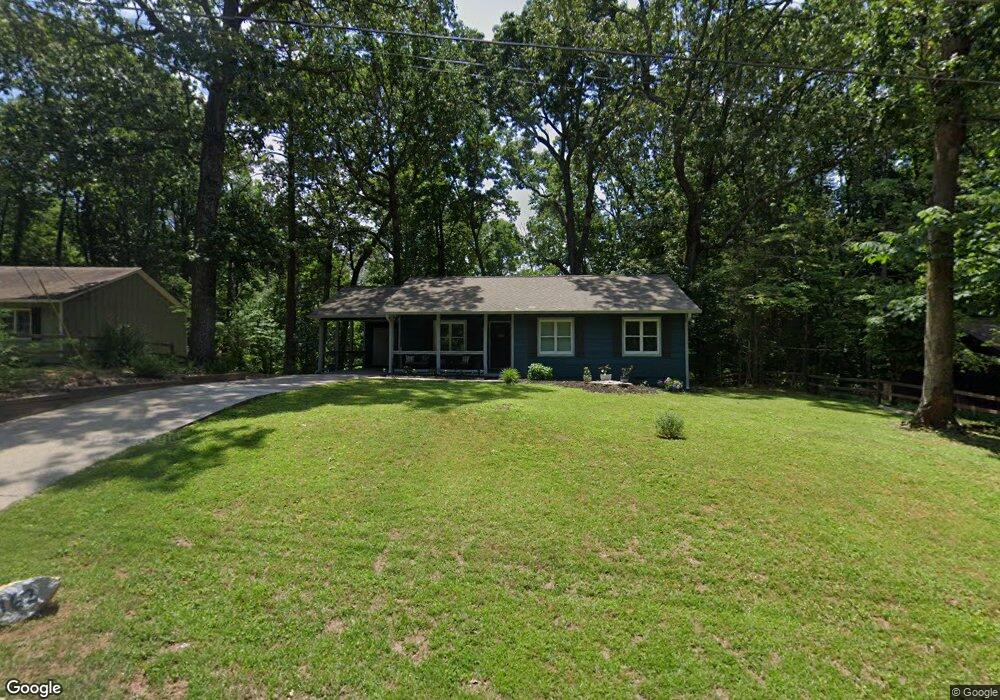
162 Deer Run Canton, GA 30114
Estimated Value: $311,876 - $360,000
3
Beds
2
Baths
1,115
Sq Ft
$301/Sq Ft
Est. Value
About This Home
This home is located at 162 Deer Run, Canton, GA 30114 and is currently estimated at $335,938, approximately $301 per square foot. 162 Deer Run is a home located in Cherokee County with nearby schools including J. Knox Elementary School, Teasley Middle School, and Cherokee High School.
Ownership History
Date
Name
Owned For
Owner Type
Purchase Details
Closed on
Aug 31, 2020
Sold by
Equity Trust Co Custodian Fbo
Bought by
Casteel Andrea
Current Estimated Value
Home Financials for this Owner
Home Financials are based on the most recent Mortgage that was taken out on this home.
Original Mortgage
$94,500
Outstanding Balance
$83,481
Interest Rate
2.9%
Mortgage Type
New Conventional
Estimated Equity
$252,457
Purchase Details
Closed on
Sep 23, 2009
Sold by
First American Asset Closing S
Bought by
Casteel James A
Purchase Details
Closed on
Jul 7, 2009
Sold by
Mauldin Philemon A
Bought by
Citimortgage Inc
Purchase Details
Closed on
Oct 26, 1994
Sold by
Duncan Donald Carlene
Bought by
Mauldin Philemon
Home Financials for this Owner
Home Financials are based on the most recent Mortgage that was taken out on this home.
Original Mortgage
$66,965
Interest Rate
8.78%
Create a Home Valuation Report for This Property
The Home Valuation Report is an in-depth analysis detailing your home's value as well as a comparison with similar homes in the area
Home Values in the Area
Average Home Value in this Area
Purchase History
| Date | Buyer | Sale Price | Title Company |
|---|---|---|---|
| Casteel Andrea | $105,000 | -- | |
| Casteel James A | $46,800 | -- | |
| Citimortgage Inc | $60,200 | -- | |
| Mauldin Philemon | $66,800 | -- |
Source: Public Records
Mortgage History
| Date | Status | Borrower | Loan Amount |
|---|---|---|---|
| Open | Casteel Andrea | $94,500 | |
| Previous Owner | Mauldin Philemon | $66,965 |
Source: Public Records
Tax History
| Year | Tax Paid | Tax Assessment Tax Assessment Total Assessment is a certain percentage of the fair market value that is determined by local assessors to be the total taxable value of land and additions on the property. | Land | Improvement |
|---|---|---|---|---|
| 2025 | $2,704 | $116,248 | $16,800 | $99,448 |
| 2024 | $2,789 | $121,208 | $16,800 | $104,408 |
| 2023 | $2,064 | $107,408 | $19,600 | $87,808 |
| 2022 | $2,177 | $90,928 | $19,600 | $71,328 |
| 2021 | $1,950 | $73,368 | $14,800 | $58,568 |
| 2020 | $1,704 | $59,968 | $14,800 | $45,168 |
| 2019 | $1,615 | $56,840 | $14,800 | $42,040 |
| 2018 | $1,425 | $49,840 | $12,400 | $37,440 |
| 2017 | $1,195 | $124,100 | $12,400 | $37,240 |
| 2016 | $1,195 | $102,600 | $9,600 | $31,440 |
| 2015 | $971 | $82,600 | $7,600 | $25,440 |
| 2014 | $939 | $79,700 | $7,600 | $24,280 |
Source: Public Records
Map
Nearby Homes
- 360 Crestwood Dr
- 191 Brookwood Dr
- 413 Arrowhead Trail Unit 4D
- 206 Providence Walk Ct
- 226 Waconda Ave
- 0 Sweetwater St
- 189 Pope Dr
- 167 Pope Dr
- 227 Elmbrook Ln Unit 3L
- 235 Elmbrook Ln
- 630 Blackwater Ridge Unit 4H
- 636 Blackwater Ridge
- 231 Villa Creek Pkwy Unit 9
- 407 Redwood Trail
- 245 Villa Creek Pkwy
- 275 Villa Creek Pkwy
- 203 River Green Ave
- 511 Highwater Pass
- 207 River Green Ave
- 234 Oakview Dr
- 142 Deer Run
- 178 Deer Run
- 200 Deer Run
- 379 Shady Brook Dr
- 379 Shady Brook Dr Unit Acres
- 160 Gold Mill Place Unit 4F
- 399 Shady Brook Dr
- 357 Shady Brook Dr Unit 2
- 164 Gold Mill Place Unit 4F
- 162 Gold Mill Place
- 158 Gold Mill Place
- 131 Fox Place
- 163 Deer Run
- 222 Deer Run
- 156 Gold Mill Place Unit 4F
- 159 Fox Place
- 232 Gold Valley Crossing Unit 4F
- 103 Deer Run
- 154 Gold Mill Place
- 224 Gold Valley Crossing
Your Personal Tour Guide
Ask me questions while you tour the home.