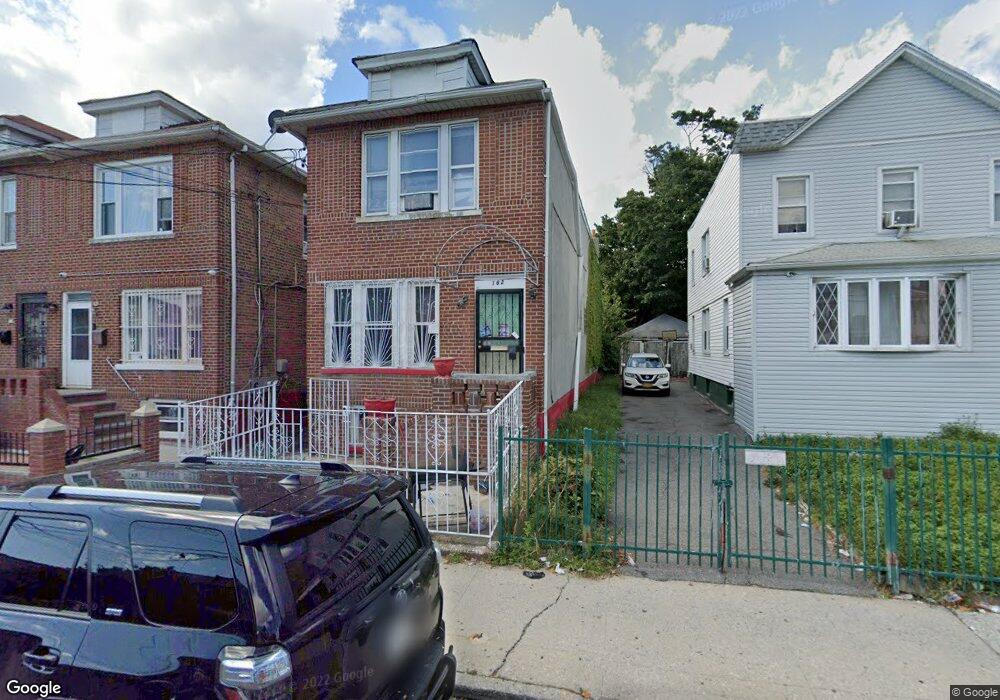
162 E 40th St Brooklyn, NY 11203
East Flatbush NeighborhoodEstimated Value: $877,000 - $1,017,000
Studio
--
Bath
2,080
Sq Ft
$446/Sq Ft
Est. Value
About This Home
This home is located at 162 E 40th St, Brooklyn, NY 11203 and is currently estimated at $927,041, approximately $445 per square foot. 162 E 40th St is a home located in Kings County with nearby schools including PS 235 Janice Marie Knight School, East Flatbush Community Research School, and East Flatbush Ascend Charter School.
Ownership History
Date
Name
Owned For
Owner Type
Purchase Details
Closed on
Jul 16, 1998
Sold by
Benoit Dawn
Bought by
Robertson Vernon
Current Estimated Value
Home Financials for this Owner
Home Financials are based on the most recent Mortgage that was taken out on this home.
Original Mortgage
$16,456
Interest Rate
6.68%
Create a Home Valuation Report for This Property
The Home Valuation Report is an in-depth analysis detailing your home's value as well as a comparison with similar homes in the area
Home Values in the Area
Average Home Value in this Area
Purchase History
| Date | Buyer | Sale Price | Title Company |
|---|---|---|---|
| Robertson Vernon | -- | Commonwealth Land Title Ins | |
| Robertson Vernon | -- | Commonwealth Land Title Ins |
Source: Public Records
Mortgage History
| Date | Status | Borrower | Loan Amount |
|---|---|---|---|
| Closed | Robertson Vernon | $16,456 |
Source: Public Records
Tax History
| Year | Tax Paid | Tax Assessment Tax Assessment Total Assessment is a certain percentage of the fair market value that is determined by local assessors to be the total taxable value of land and additions on the property. | Land | Improvement |
|---|---|---|---|---|
| 2025 | $7,119 | $64,140 | $15,780 | $48,360 |
| 2024 | $7,119 | $60,660 | $15,780 | $44,880 |
| 2023 | $6,791 | $64,140 | $15,780 | $48,360 |
| 2022 | $6,437 | $55,920 | $15,780 | $40,140 |
| 2021 | $6,786 | $53,880 | $15,780 | $38,100 |
| 2019 | $6,179 | $38,940 | $15,780 | $23,160 |
| 2018 | $5,681 | $27,867 | $12,154 | $15,713 |
| 2017 | $5,478 | $26,872 | $12,826 | $14,046 |
| 2016 | $5,372 | $26,872 | $12,967 | $13,905 |
| 2015 | $3,058 | $26,092 | $14,321 | $11,771 |
| 2014 | $3,058 | $24,616 | $13,360 | $11,256 |
Source: Public Records
Map
Nearby Homes
- 4017 Church Ave Unit BUILDING
- 200 E 39th St
- 125 E 42nd St
- 555 Linden Blvd
- 576 Linden Blvd
- 230 E 42nd St
- 234 E 42nd St
- 221 E 42nd St
- 282 E 38th St
- 145 E 38th St
- 4211 Snyder Ave
- 266 E 37th St
- 278 E 37th St
- 935 Brooklyn Ave
- 902 Brooklyn Ave
- 755 Albany Ave
- 40 E 43rd St Unit 4H
- 40 E 43rd St Unit 2K
- 625 Lenox Rd
- 750 Troy Ave
Your Personal Tour Guide
Ask me questions while you tour the home.