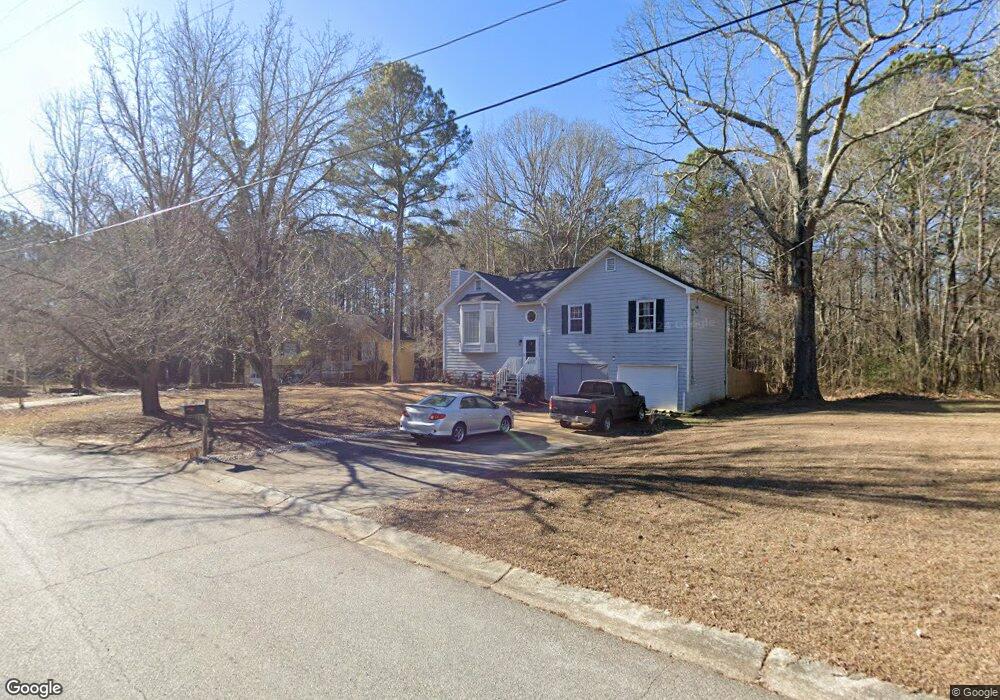
162 Landing Trail Powder Springs, GA 30127
Estimated Value: $263,486 - $287,000
3
Beds
2
Baths
1,186
Sq Ft
$228/Sq Ft
Est. Value
About This Home
This home is located at 162 Landing Trail, Powder Springs, GA 30127 and is currently estimated at $270,872, approximately $228 per square foot. 162 Landing Trail is a home located in Paulding County with nearby schools including Hal Hutchens Elementary School, J. A. Dobbins Middle School, and Hiram High School.
Ownership History
Date
Name
Owned For
Owner Type
Purchase Details
Closed on
Oct 28, 2005
Sold by
Mortgage Guaranty Ins Mgic
Bought by
Sanders Dequincy L and Sanders Marilyn
Current Estimated Value
Home Financials for this Owner
Home Financials are based on the most recent Mortgage that was taken out on this home.
Original Mortgage
$25,700
Interest Rate
5.84%
Mortgage Type
New Conventional
Purchase Details
Closed on
Sep 20, 2005
Sold by
Federal Home Loan Mortgage Corporation
Bought by
Mortgage Guaranty Ins Mgic
Home Financials for this Owner
Home Financials are based on the most recent Mortgage that was taken out on this home.
Original Mortgage
$25,700
Interest Rate
5.84%
Mortgage Type
New Conventional
Purchase Details
Closed on
Sep 9, 1993
Sold by
Paulding Prop
Bought by
Ward Billy W and Ward Kelly S
Home Financials for this Owner
Home Financials are based on the most recent Mortgage that was taken out on this home.
Original Mortgage
$69,848
Interest Rate
7.22%
Create a Home Valuation Report for This Property
The Home Valuation Report is an in-depth analysis detailing your home's value as well as a comparison with similar homes in the area
Home Values in the Area
Average Home Value in this Area
Purchase History
| Date | Buyer | Sale Price | Title Company |
|---|---|---|---|
| Sanders Dequincy L | $128,500 | -- | |
| Sanders Dequincy L | -- | -- | |
| Mortgage Guaranty Ins Mgic | -- | -- | |
| Ward Billy W | $69,300 | -- |
Source: Public Records
Mortgage History
| Date | Status | Borrower | Loan Amount |
|---|---|---|---|
| Previous Owner | Sanders Dequincy L | $25,700 | |
| Previous Owner | Sanders Dequincy L | $102,800 | |
| Previous Owner | Mortgage Guaranty Ins Mgic | $25,700 | |
| Previous Owner | Ward Billy W | $69,848 |
Source: Public Records
Tax History Compared to Growth
Tax History
| Year | Tax Paid | Tax Assessment Tax Assessment Total Assessment is a certain percentage of the fair market value that is determined by local assessors to be the total taxable value of land and additions on the property. | Land | Improvement |
|---|---|---|---|---|
| 2024 | $2,526 | $104,776 | $12,000 | $92,776 |
| 2023 | $2,671 | $104,984 | $12,000 | $92,984 |
| 2022 | $2,370 | $92,804 | $12,000 | $80,804 |
| 2021 | $1,718 | $60,976 | $8,000 | $52,976 |
| 2020 | $1,723 | $59,876 | $8,000 | $51,876 |
| 2019 | $1,574 | $54,096 | $8,000 | $46,096 |
| 2018 | $1,457 | $50,236 | $8,000 | $42,236 |
| 2017 | $1,211 | $41,520 | $8,000 | $33,520 |
| 2016 | $1,121 | $38,924 | $8,000 | $30,924 |
| 2015 | $990 | $34,036 | $8,000 | $26,036 |
| 2014 | $724 | $24,784 | $8,000 | $16,784 |
| 2013 | -- | $15,880 | $6,000 | $9,880 |
Source: Public Records
Map
Nearby Homes
- 145 Mary Hill Ln
- 31 Sweetwater Pass
- 231 Breckenridge Ln
- 99 Breckenridge Ln
- 0 Borrow Pit Rd Unit 10504034
- 00 Borrow Pit Rd
- 420 Florence Rd
- 397 Lovejoy Cir
- 392 Beranda Cir
- 180 Wimberly Way
- 258 Wimberly Way
- 422 Enclave Dr
- 115 Haven Brook Way
- 260 Sterling Dr
- 0 Cave Springs Rd Unit 7639017
- 0 Cave Springs Rd Unit 10591846
- 0 Cave Springs Rd Unit 10488626
- 0 Cave Springs Rd Unit 7549618
- The James Plan at Glen at Cave Springs
- The Bradley Plan at Glen at Cave Springs
- 176 Landing Trail
- 146 Landing Trail
- 190 Landing Trail
- 145 Landing Trail
- 122 Landing Trail
- 123 Landing Trail
- 168 Sweetwater Pkwy
- 90 Sweetwater Pkwy
- 102 Landing Trail
- 0 Landing Trail Unit 3283943
- 0 Landing Trail Unit 7192302
- 0 Landing Trail Unit 3241923
- 0 Landing Trail Unit 8419506
- 0 Landing Trail Unit 7078348
- 0 Landing Trail Unit 7033436
- 0 Landing Trail Unit 7109369
- 5 Sweetwater Way
- 190 Sweetwater Pkwy
- 105 Landing Trail
- 80 Landing Trail