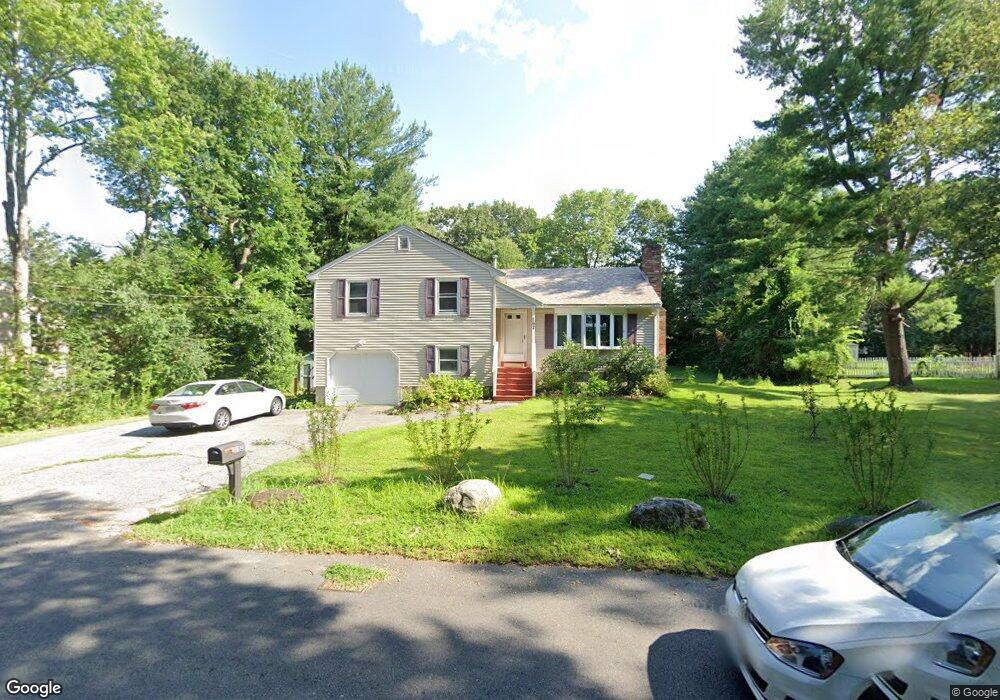
162 Maple St Methuen, MA 01844
The North End NeighborhoodEstimated Value: $511,000 - $743,000
3
Beds
2
Baths
1,834
Sq Ft
$353/Sq Ft
Est. Value
About This Home
This home is located at 162 Maple St, Methuen, MA 01844 and is currently estimated at $648,234, approximately $353 per square foot. 162 Maple St is a home located in Essex County with nearby schools including Methuen High School and The Birches Academy of Academics and Art.
Ownership History
Date
Name
Owned For
Owner Type
Purchase Details
Closed on
Nov 12, 1998
Sold by
Korbani George
Bought by
Nguyen Guynh Tram and Le Nho Thi
Current Estimated Value
Home Financials for this Owner
Home Financials are based on the most recent Mortgage that was taken out on this home.
Original Mortgage
$128,000
Interest Rate
6.65%
Mortgage Type
Purchase Money Mortgage
Create a Home Valuation Report for This Property
The Home Valuation Report is an in-depth analysis detailing your home's value as well as a comparison with similar homes in the area
Home Values in the Area
Average Home Value in this Area
Purchase History
| Date | Buyer | Sale Price | Title Company |
|---|---|---|---|
| Nguyen Guynh Tram | $160,000 | -- |
Source: Public Records
Mortgage History
| Date | Status | Borrower | Loan Amount |
|---|---|---|---|
| Open | Nguyen Guynh Tram | $111,000 | |
| Closed | Nguyen Guynh Tram | $128,000 | |
| Previous Owner | Nguyen Guynh Tram | $45,500 |
Source: Public Records
Tax History
| Year | Tax Paid | Tax Assessment Tax Assessment Total Assessment is a certain percentage of the fair market value that is determined by local assessors to be the total taxable value of land and additions on the property. | Land | Improvement |
|---|---|---|---|---|
| 2025 | $5,721 | $540,700 | $271,200 | $269,500 |
| 2024 | $5,740 | $528,500 | $247,400 | $281,100 |
| 2023 | $5,424 | $463,600 | $219,900 | $243,700 |
| 2022 | $5,191 | $397,800 | $183,200 | $214,600 |
| 2021 | $4,876 | $369,700 | $174,100 | $195,600 |
| 2020 | $4,871 | $362,400 | $174,100 | $188,300 |
| 2019 | $4,629 | $326,200 | $155,800 | $170,400 |
| 2018 | $4,526 | $317,200 | $155,800 | $161,400 |
| 2017 | $4,536 | $309,600 | $155,800 | $153,800 |
| 2016 | $4,381 | $295,800 | $146,600 | $149,200 |
| 2015 | $4,319 | $295,800 | $146,600 | $149,200 |
Source: Public Records
Map
Nearby Homes
- 11 Brookside Ct
- 139 North St
- 18 Shepard Ave
- 20 Williams St
- 7 Tree Top Way
- 3 Adams Ave
- 159-161 Howe St
- 34 Sable Run Ln
- 28 Currier Ave
- 55 Phoebe St Unit 32
- 7 Benning St
- 64-66 Howe St
- 59 Cluff Rd Unit 80
- 59 Cluff Rd Unit 62
- 40 Stanwood Rd Unit 9
- 40 Phoebe St Unit 101
- 8 Ridgeview Ave
- 10 Braemoor Woods Rd Unit 401
- 25 Carol Ave
- 127 Phoebe St Unit 127
Your Personal Tour Guide
Ask me questions while you tour the home.