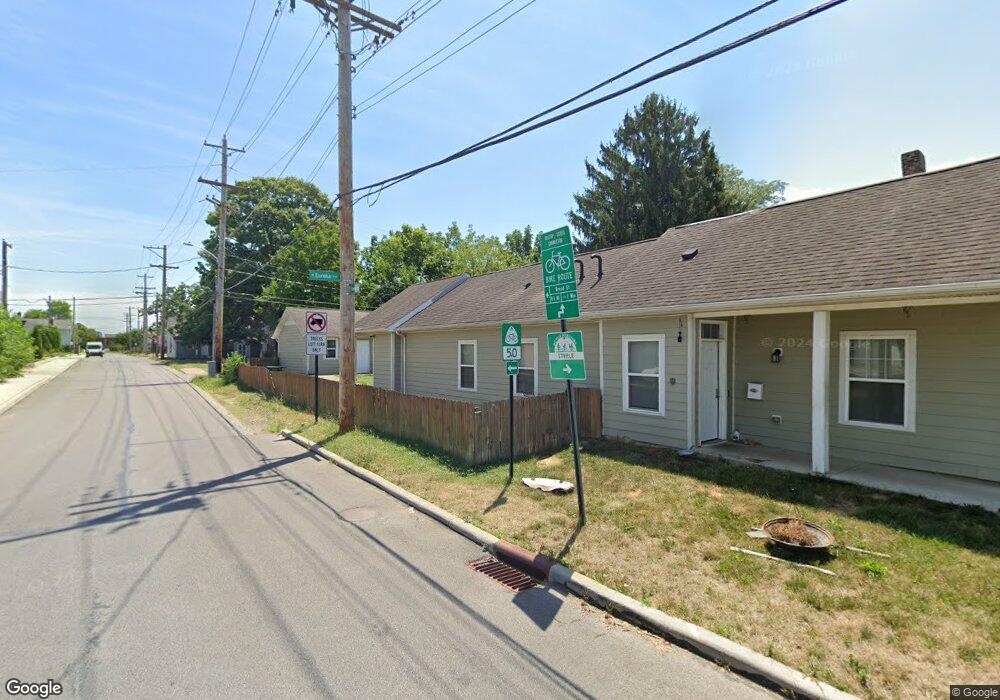
162 N Eureka Ave Columbus, OH 43204
North Hilltop NeighborhoodEstimated Value: $111,000 - $194,000
3
Beds
2
Baths
1,499
Sq Ft
$109/Sq Ft
Est. Value
About This Home
This home is located at 162 N Eureka Ave, Columbus, OH 43204 and is currently estimated at $162,718, approximately $108 per square foot. 162 N Eureka Ave is a home with nearby schools including West Broad Elementary School, Westmoor Middle School, and West High School.
Ownership History
Date
Name
Owned For
Owner Type
Purchase Details
Closed on
Nov 16, 2010
Sold by
City Of Columbus
Bought by
Hilltop Housing Lp
Current Estimated Value
Home Financials for this Owner
Home Financials are based on the most recent Mortgage that was taken out on this home.
Original Mortgage
$2,058,299
Outstanding Balance
$1,354,571
Interest Rate
4.22%
Mortgage Type
Future Advance Clause Open End Mortgage
Estimated Equity
-$1,191,853
Purchase Details
Closed on
Oct 20, 2009
Sold by
Reime Archie F and Reime Brenda L
Bought by
City Of Columbus
Purchase Details
Closed on
Jul 10, 1996
Sold by
Moore Douglas L
Bought by
Reime Archie F and Reime Brenda L
Home Financials for this Owner
Home Financials are based on the most recent Mortgage that was taken out on this home.
Original Mortgage
$35,250
Interest Rate
8.09%
Mortgage Type
Balloon
Purchase Details
Closed on
Mar 1, 1987
Purchase Details
Closed on
Jun 1, 1979
Create a Home Valuation Report for This Property
The Home Valuation Report is an in-depth analysis detailing your home's value as well as a comparison with similar homes in the area
Home Values in the Area
Average Home Value in this Area
Purchase History
| Date | Buyer | Sale Price | Title Company |
|---|---|---|---|
| Hilltop Housing Lp | -- | Star Title Agency Llc | |
| City Of Columbus | $4,459 | Attorney | |
| Reime Archie F | $37,000 | -- | |
| -- | $35,000 | -- | |
| -- | $25,000 | -- |
Source: Public Records
Mortgage History
| Date | Status | Borrower | Loan Amount |
|---|---|---|---|
| Open | Hilltop Housing Lp | $2,058,299 | |
| Previous Owner | Reime Archie F | $35,250 |
Source: Public Records
Tax History Compared to Growth
Tax History
| Year | Tax Paid | Tax Assessment Tax Assessment Total Assessment is a certain percentage of the fair market value that is determined by local assessors to be the total taxable value of land and additions on the property. | Land | Improvement |
|---|---|---|---|---|
| 2024 | $1,019 | $12,500 | $5,250 | $7,250 |
| 2023 | $1,006 | $22,225 | $5,250 | $16,975 |
| 2022 | $681 | $12,810 | $1,750 | $11,060 |
| 2021 | $804 | $12,810 | $1,750 | $11,060 |
| 2020 | $683 | $12,810 | $1,750 | $11,060 |
| 2019 | $1,352 | $12,810 | $1,750 | $11,060 |
| 2018 | $1,341 | $21,740 | $1,680 | $20,060 |
| 2017 | $1,020 | $21,740 | $1,680 | $20,060 |
| 2016 | $545 | $8,020 | $4,970 | $3,050 |
| 2015 | $1,333 | $19,180 | $4,970 | $14,210 |
| 2014 | $1,189 | $19,180 | $4,970 | $14,210 |
| 2013 | $691 | $22,575 | $5,845 | $16,730 |
Source: Public Records
Map
Nearby Homes
- 188 N Eureka Ave
- 149 N Eureka Ave
- 120 N Eureka Ave Unit 122
- 146 N Wayne Ave
- 285 N Wayne Ave
- 274 N Wayne Ave
- 210 N Oakley Ave
- 117-119 N Wheatland Ave
- 75 N Terrace Ave
- 127 N Burgess Ave
- 78 N Burgess Ave
- 2360 Westwood Dr
- 298 N Burgess Ave
- 67 N Wheatland Ave
- 118 N Ogden Ave
- 27 S Oakley Ave
- 87 N Warren Ave
- 57 S Eureka Ave
- 166 N Harris Ave
- 200-202 N Harris Ave
- 178 N Eureka Ave
- 161 N Wayne Ave Unit 163
- 2424 Steele Ave
- 184 N Eureka Ave
- 161 N Eureka Ave
- 165 N Eureka Ave
- 165 N Wayne Ave
- 192 N Eureka Ave
- 179 N Wayne Ave
- 147 N Wayne Ave
- 183 N Wayne Ave
- 2438 Steele Ave
- 202 N Eureka Ave
- 145 N Eureka Ave
- 145 N Eureka Ave
- 187 N Wayne Ave
- 193 N Eureka Ave
- 145 N Wayne Ave
- 191 N Wayne Ave
- 130-132 N Eureka Ave