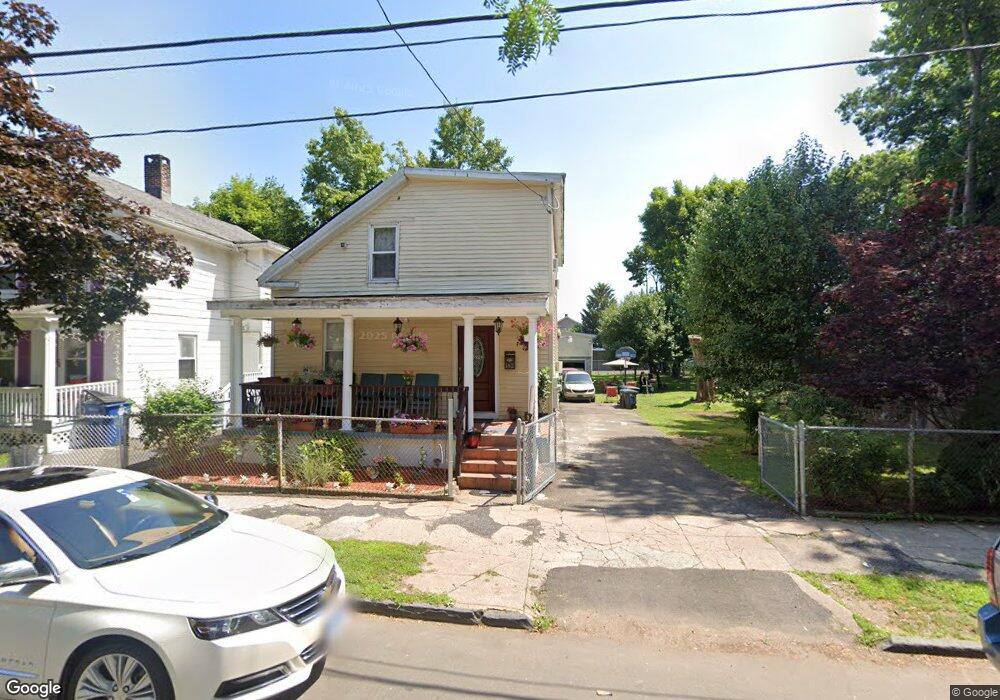
162 Pine St New Haven, CT 06513
Fair Haven NeighborhoodEstimated Value: $320,000 - $441,000
3
Beds
4
Baths
1,559
Sq Ft
$233/Sq Ft
Est. Value
About This Home
This home is located at 162 Pine St, New Haven, CT 06513 and is currently estimated at $363,127, approximately $232 per square foot. 162 Pine St is a home located in New Haven County with nearby schools including Clinton Avenue School, Elm City College Preparatory School, and All Saints Catholic Academy.
Ownership History
Date
Name
Owned For
Owner Type
Purchase Details
Closed on
Jun 6, 1995
Sold by
Cipollini Paul A
Bought by
Rivera Awilda
Current Estimated Value
Home Financials for this Owner
Home Financials are based on the most recent Mortgage that was taken out on this home.
Original Mortgage
$28,500
Interest Rate
8.2%
Mortgage Type
Unknown
Create a Home Valuation Report for This Property
The Home Valuation Report is an in-depth analysis detailing your home's value as well as a comparison with similar homes in the area
Home Values in the Area
Average Home Value in this Area
Purchase History
| Date | Buyer | Sale Price | Title Company |
|---|---|---|---|
| Rivera Awilda | $38,000 | -- |
Source: Public Records
Mortgage History
| Date | Status | Borrower | Loan Amount |
|---|---|---|---|
| Open | Rivera Awilda | $97,500 | |
| Closed | Rivera Awilda | $61,100 | |
| Closed | Rivera Awilda | $50,000 | |
| Closed | Rivera Awilda | $28,500 |
Source: Public Records
Tax History
| Year | Tax Paid | Tax Assessment Tax Assessment Total Assessment is a certain percentage of the fair market value that is determined by local assessors to be the total taxable value of land and additions on the property. | Land | Improvement |
|---|---|---|---|---|
| 2025 | $8,735 | $221,690 | $30,240 | $191,450 |
| 2024 | $8,535 | $221,690 | $30,240 | $191,450 |
| 2023 | $8,247 | $221,690 | $30,240 | $191,450 |
| 2022 | $8,812 | $221,690 | $30,240 | $191,450 |
| 2021 | $5,633 | $128,380 | $24,150 | $104,230 |
| 2020 | $5,633 | $128,380 | $24,150 | $104,230 |
| 2019 | $5,518 | $128,380 | $24,150 | $104,230 |
| 2018 | $5,518 | $128,380 | $24,150 | $104,230 |
| 2017 | $4,966 | $128,380 | $24,150 | $104,230 |
| 2016 | $4,994 | $120,190 | $16,100 | $104,090 |
| 2015 | $4,994 | $120,190 | $16,100 | $104,090 |
| 2014 | $4,994 | $120,190 | $16,100 | $104,090 |
Source: Public Records
Map
Nearby Homes
Your Personal Tour Guide
Ask me questions while you tour the home.