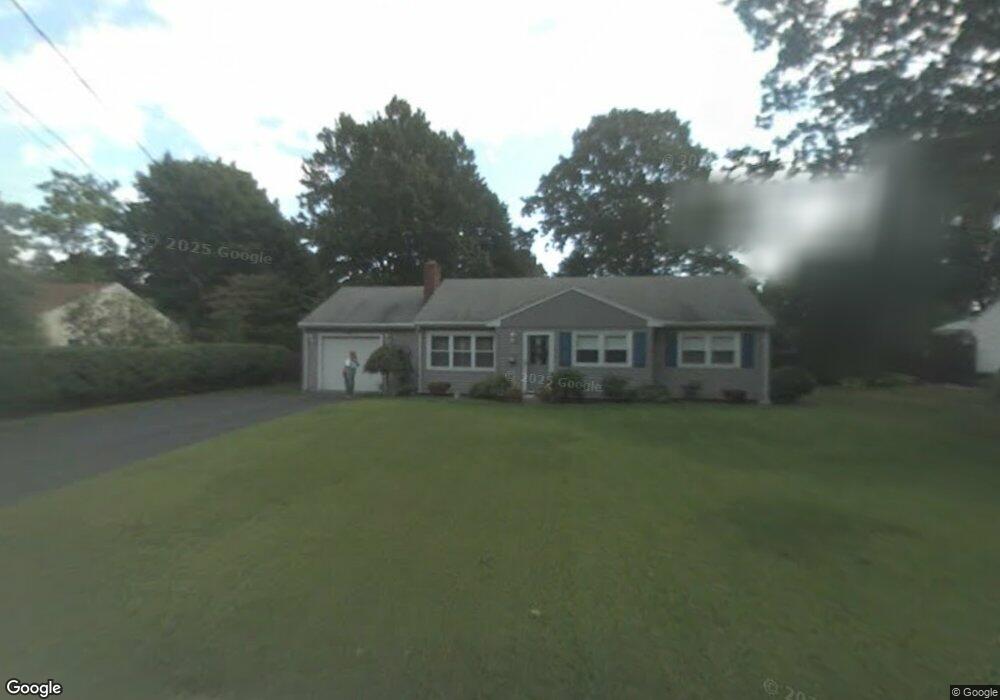
162 Richmond Dr Warwick, RI 02888
Lakewood NeighborhoodEstimated Value: $398,926 - $468,000
3
Beds
2
Baths
1,582
Sq Ft
$269/Sq Ft
Est. Value
About This Home
This home is located at 162 Richmond Dr, Warwick, RI 02888 and is currently estimated at $425,482, approximately $268 per square foot. 162 Richmond Dr is a home located in Kent County with nearby schools including St. Peter School and Saint Paul School.
Ownership History
Date
Name
Owned For
Owner Type
Purchase Details
Closed on
Aug 24, 2009
Sold by
Gosselin Ann
Bought by
Ripley-Manamar Kristin D
Current Estimated Value
Home Financials for this Owner
Home Financials are based on the most recent Mortgage that was taken out on this home.
Original Mortgage
$177,859
Outstanding Balance
$115,372
Interest Rate
5.19%
Mortgage Type
Purchase Money Mortgage
Estimated Equity
$310,110
Purchase Details
Closed on
Apr 8, 2004
Sold by
Pasela Julian L and Pasela Edna E
Bought by
Gosselin Ann
Home Financials for this Owner
Home Financials are based on the most recent Mortgage that was taken out on this home.
Original Mortgage
$100,000
Interest Rate
5.6%
Mortgage Type
Purchase Money Mortgage
Purchase Details
Closed on
Aug 28, 1998
Sold by
Tilton Earle E and State St Bank & Tr Co
Bought by
Pasela Julian L and Pasela Edna E
Home Financials for this Owner
Home Financials are based on the most recent Mortgage that was taken out on this home.
Original Mortgage
$50,000
Interest Rate
6.9%
Mortgage Type
Purchase Money Mortgage
Create a Home Valuation Report for This Property
The Home Valuation Report is an in-depth analysis detailing your home's value as well as a comparison with similar homes in the area
Home Values in the Area
Average Home Value in this Area
Purchase History
| Date | Buyer | Sale Price | Title Company |
|---|---|---|---|
| Ripley-Manamar Kristin D | $184,000 | -- | |
| Gosselin Ann | $215,000 | -- | |
| Pasela Julian L | $65,500 | -- |
Source: Public Records
Mortgage History
| Date | Status | Borrower | Loan Amount |
|---|---|---|---|
| Open | Pasela Julian L | $25,000 | |
| Open | Pasela Julian L | $177,859 | |
| Previous Owner | Pasela Julian L | $100,000 | |
| Previous Owner | Pasela Julian L | $50,000 |
Source: Public Records
Tax History
| Year | Tax Paid | Tax Assessment Tax Assessment Total Assessment is a certain percentage of the fair market value that is determined by local assessors to be the total taxable value of land and additions on the property. | Land | Improvement |
|---|---|---|---|---|
| 2025 | $4,404 | $346,800 | $104,600 | $242,200 |
| 2024 | $4,289 | $296,400 | $90,900 | $205,500 |
| 2023 | $4,206 | $296,400 | $90,900 | $205,500 |
| 2022 | $4,031 | $215,200 | $60,500 | $154,700 |
| 2021 | $4,031 | $215,200 | $60,500 | $154,700 |
| 2020 | $4,031 | $215,200 | $60,500 | $154,700 |
| 2019 | $4,031 | $215,200 | $60,500 | $154,700 |
| 2018 | $3,414 | $168,700 | $60,500 | $108,200 |
| 2017 | $3,414 | $168,700 | $60,500 | $108,200 |
| 2016 | $3,414 | $168,700 | $60,500 | $108,200 |
| 2015 | $3,191 | $153,800 | $60,200 | $93,600 |
| 2014 | $3,085 | $153,800 | $60,200 | $93,600 |
| 2013 | $3,044 | $153,800 | $60,200 | $93,600 |
Source: Public Records
Map
Nearby Homes
- 127 Sherwood Ave
- 111 Sherwood Ave
- 171 Sherwood Ave
- 65 Perkins Ave
- 136 Sherwood Ave
- 120 Sherwood Ave
- 25 Newfield Ave
- 80 George St
- 129 1st Ave
- 0 Elmwood Ave
- 123 Harrington Ave
- 94 Holmes Rd
- 115 Irving Rd
- 210 Irving Rd
- 821 Post Rd
- 25 Sharon St Unit 2
- 27 Vickery St
- 35 Welfare Ave
- 10 Woburn St
- 150 Riverside Ave
- 154 Richmond Dr
- 170 Richmond Dr
- 178 Richmond Dr
- 144 Richmond Dr
- 9 Sherwood Ave
- 17 Sherwood Ave
- 183 Richmond Dr
- 34 Northampton St
- 26 Northampton St
- 194 Richmond Dr
- 42 Northampton St
- 16 Northampton St
- 210 Richmond Dr
- 14 Sherwood Ave
- 4 Sherwood Ave
- 187 Richmond Dr
- 33 Northampton St
- 6 Northampton St
- 25 Northampton St
- 41 Northampton St
Your Personal Tour Guide
Ask me questions while you tour the home.