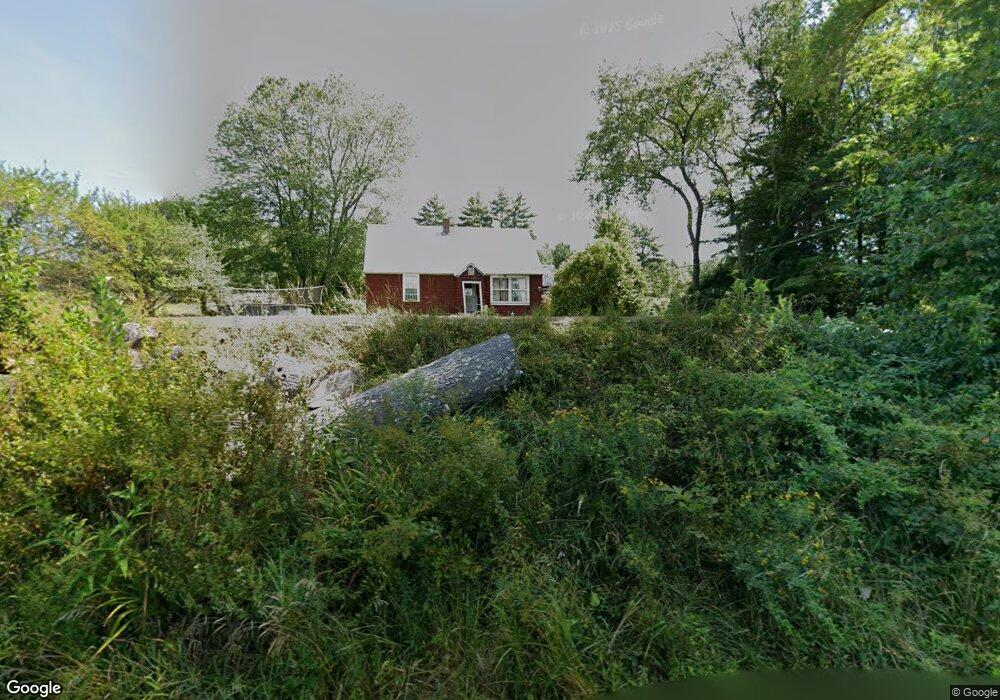
162 Wheeler Ave Orange, MA 01364
Estimated Value: $287,000 - $379,000
3
Beds
1
Bath
1,260
Sq Ft
$263/Sq Ft
Est. Value
About This Home
This home is located at 162 Wheeler Ave, Orange, MA 01364 and is currently estimated at $331,510, approximately $263 per square foot. 162 Wheeler Ave is a home located in Franklin County with nearby schools including Fisher Hill and Ralph C Mahar Regional School.
Ownership History
Date
Name
Owned For
Owner Type
Purchase Details
Closed on
Nov 15, 2004
Sold by
Wheeler Avenue Rt and Gray Roland
Bought by
Loretan Jonathan G
Current Estimated Value
Home Financials for this Owner
Home Financials are based on the most recent Mortgage that was taken out on this home.
Original Mortgage
$113,900
Outstanding Balance
$56,726
Interest Rate
5.75%
Mortgage Type
Purchase Money Mortgage
Estimated Equity
$274,784
Create a Home Valuation Report for This Property
The Home Valuation Report is an in-depth analysis detailing your home's value as well as a comparison with similar homes in the area
Home Values in the Area
Average Home Value in this Area
Purchase History
| Date | Buyer | Sale Price | Title Company |
|---|---|---|---|
| Loretan Jonathan G | $119,900 | -- |
Source: Public Records
Mortgage History
| Date | Status | Borrower | Loan Amount |
|---|---|---|---|
| Open | Loretan Jonathan G | $113,900 |
Source: Public Records
Tax History Compared to Growth
Tax History
| Year | Tax Paid | Tax Assessment Tax Assessment Total Assessment is a certain percentage of the fair market value that is determined by local assessors to be the total taxable value of land and additions on the property. | Land | Improvement |
|---|---|---|---|---|
| 2025 | $43 | $263,600 | $34,800 | $228,800 |
| 2024 | $3,561 | $204,200 | $34,800 | $169,400 |
| 2023 | $2,953 | $164,400 | $34,800 | $129,600 |
| 2022 | $3,044 | $159,200 | $34,800 | $124,400 |
| 2021 | $3,040 | $151,600 | $51,400 | $100,200 |
| 2020 | $3,054 | $150,200 | $51,000 | $99,200 |
| 2019 | $2,955 | $131,200 | $44,400 | $86,800 |
| 2018 | $2,789 | $127,100 | $41,400 | $85,700 |
| 2017 | $2,698 | $127,100 | $41,400 | $85,700 |
| 2016 | $2,561 | $118,000 | $41,400 | $76,600 |
| 2015 | $2,451 | $118,000 | $41,400 | $76,600 |
| 2014 | $2,349 | $119,000 | $41,400 | $77,600 |
Source: Public Records
Map
Nearby Homes