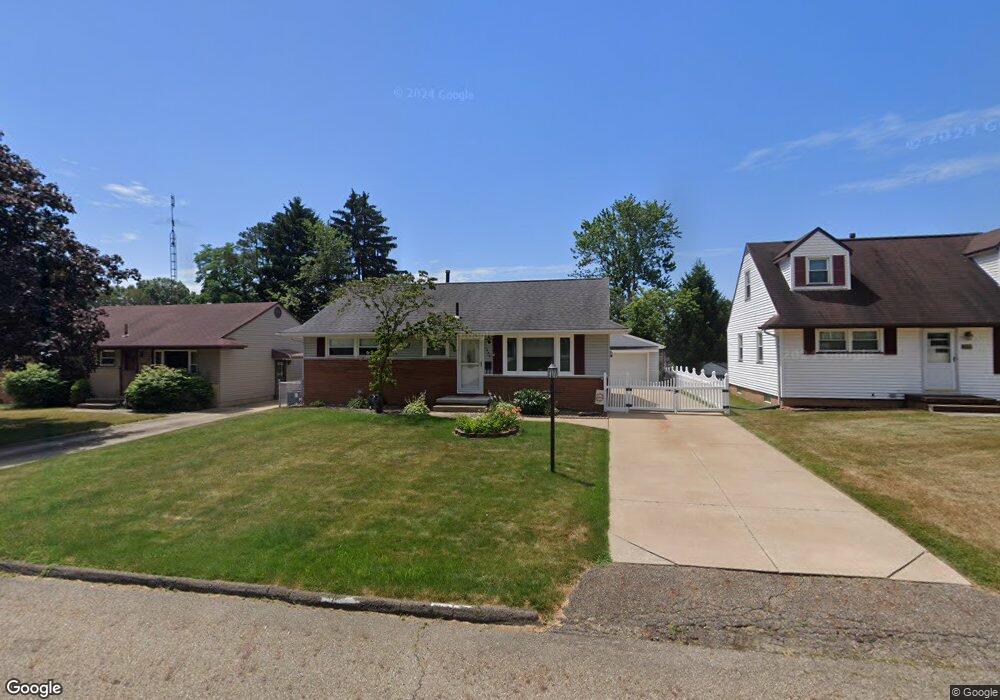
1620 35th St NE Canton, OH 44714
Estimated Value: $161,271 - $208,000
3
Beds
2
Baths
988
Sq Ft
$190/Sq Ft
Est. Value
About This Home
This home is located at 1620 35th St NE, Canton, OH 44714 and is currently estimated at $188,068, approximately $190 per square foot. 1620 35th St NE is a home located in Stark County with nearby schools including Frazer Elementary School, Glenwood Intermediate School, and GlenOak High School.
Ownership History
Date
Name
Owned For
Owner Type
Purchase Details
Closed on
Aug 16, 2019
Sold by
Mccallister Jason P
Bought by
Mccallister Laura A
Current Estimated Value
Home Financials for this Owner
Home Financials are based on the most recent Mortgage that was taken out on this home.
Original Mortgage
$94,118
Interest Rate
3.7%
Mortgage Type
FHA
Purchase Details
Closed on
Feb 20, 2007
Sold by
Wehrlin Patrick J and Wehrlin Theresa L
Bought by
Mccallister Jason P and Mccallister Laura A
Home Financials for this Owner
Home Financials are based on the most recent Mortgage that was taken out on this home.
Original Mortgage
$114,500
Interest Rate
6.23%
Mortgage Type
Purchase Money Mortgage
Purchase Details
Closed on
Sep 19, 2001
Sold by
Leeders Robert W and Leeders Brenda K
Bought by
Wehrlin Patrick J and Winkler Theresa L
Home Financials for this Owner
Home Financials are based on the most recent Mortgage that was taken out on this home.
Original Mortgage
$89,300
Interest Rate
7.06%
Mortgage Type
Purchase Money Mortgage
Create a Home Valuation Report for This Property
The Home Valuation Report is an in-depth analysis detailing your home's value as well as a comparison with similar homes in the area
Home Values in the Area
Average Home Value in this Area
Purchase History
| Date | Buyer | Sale Price | Title Company |
|---|---|---|---|
| Mccallister Laura A | -- | None Available | |
| Mccallister Jason P | $114,500 | Clear Title Solutions | |
| Wehrlin Patrick J | $94,000 | Quest Title Agency Inc |
Source: Public Records
Mortgage History
| Date | Status | Borrower | Loan Amount |
|---|---|---|---|
| Closed | Mccallister Laura A | $94,118 | |
| Closed | Mccallister Jason P | $114,500 | |
| Closed | Wehrlin Patrick J | $89,300 |
Source: Public Records
Tax History
| Year | Tax Paid | Tax Assessment Tax Assessment Total Assessment is a certain percentage of the fair market value that is determined by local assessors to be the total taxable value of land and additions on the property. | Land | Improvement |
|---|---|---|---|---|
| 2025 | -- | $49,180 | $9,700 | $39,480 |
| 2024 | -- | $49,180 | $9,700 | $39,480 |
| 2023 | $1,811 | $38,860 | $8,440 | $30,420 |
| 2022 | $1,821 | $38,860 | $8,440 | $30,420 |
| 2021 | $1,829 | $38,860 | $8,440 | $30,420 |
| 2020 | $1,728 | $33,400 | $7,250 | $26,150 |
| 2019 | $1,713 | $33,400 | $7,250 | $26,150 |
Source: Public Records
Map
Nearby Homes
- 1624 34th St NE
- 1331 Spangler St NE
- 2333 Ivy Way St NE
- 3843 Roosevelt Ave NE
- 910 Milford St NE
- 1610 Colonial Blvd NE
- 1115 Colonial Blvd NE
- 1410 Colonial Blvd NE
- 206 33rd St NW
- 804 28th St NE
- 1617 Southpointe Cir NE Unit 20
- 815 44th St NE
- 1610 23rd St NE
- 1218 24th St NE
- 2616 Taft Ave NE
- 2219 Rowland Ave NE
- 2328 26th St NE
- 414 32nd St NW
- 0 Dover Ave NE
- 4662 Helmsworth Dr NE
- 1614 35th St NE
- 1608 35th St NE
- 1630 35th St NE
- 1619 34th St NE
- 1625 34th St NE
- 1615 34th St NE
- 1634 35th St NE
- 1631 34th St NE
- 3422 Gross Ave NE
- 1609 34th St NE
- 1621 35th St NE
- 1625 35th St NE
- 1615 35th St NE
- 1631 35th St NE
- 1603 34th St NE
- 1640 35th St NE
- 1641 34th St NE
- 3502 Gross Ave NE
- 3425 Gross Ave NE
- 1647 34th St NE
Your Personal Tour Guide
Ask me questions while you tour the home.