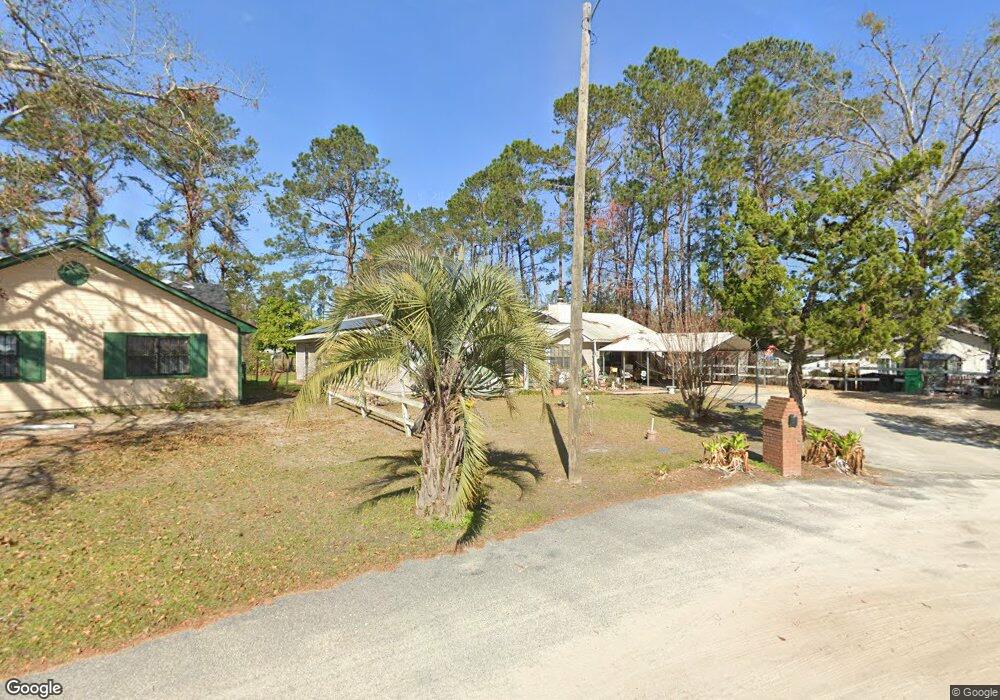
1620 Euclid St Valdosta, GA 31602
Estimated Value: $162,902 - $188,000
3
Beds
3
Baths
1,768
Sq Ft
$101/Sq Ft
Est. Value
About This Home
This home is located at 1620 Euclid St, Valdosta, GA 31602 and is currently estimated at $177,976, approximately $100 per square foot. 1620 Euclid St is a home located in Lowndes County with nearby schools including W.G. Nunn Elementary School, Newbern Middle School, and Valdosta High School.
Ownership History
Date
Name
Owned For
Owner Type
Purchase Details
Closed on
Dec 30, 2005
Sold by
Stevens Randall
Bought by
Griffin Pernell and Griffin Wanda
Current Estimated Value
Home Financials for this Owner
Home Financials are based on the most recent Mortgage that was taken out on this home.
Original Mortgage
$82,365
Outstanding Balance
$55,327
Interest Rate
9.82%
Mortgage Type
New Conventional
Estimated Equity
$122,649
Purchase Details
Closed on
Apr 28, 2004
Sold by
Dinkins Dinkins B and Dinkins Carolyn T
Bought by
Stevens Randall
Home Financials for this Owner
Home Financials are based on the most recent Mortgage that was taken out on this home.
Original Mortgage
$13,500
Interest Rate
5.49%
Mortgage Type
New Conventional
Purchase Details
Closed on
Dec 17, 2003
Sold by
Rigby Robert T and Rigby Bettin
Bought by
Dinkins Dinkins B and Dinkins Carolyn T
Purchase Details
Closed on
Feb 13, 1987
Bought by
Rigby Bettina H
Purchase Details
Closed on
Oct 22, 1985
Bought by
Rigby Robert T
Create a Home Valuation Report for This Property
The Home Valuation Report is an in-depth analysis detailing your home's value as well as a comparison with similar homes in the area
Home Values in the Area
Average Home Value in this Area
Purchase History
| Date | Buyer | Sale Price | Title Company |
|---|---|---|---|
| Griffin Pernell | $96,900 | -- | |
| Stevens Randall | $89,900 | -- | |
| Dinkins Dinkins B | $55,000 | -- | |
| Rigby Bettina H | -- | -- | |
| Rigby Robert T | -- | -- | |
| Rigby Robert T | $11,500 | -- |
Source: Public Records
Mortgage History
| Date | Status | Borrower | Loan Amount |
|---|---|---|---|
| Open | Griffin Pernell | $82,365 | |
| Previous Owner | Stevens Randall | $13,500 |
Source: Public Records
Tax History Compared to Growth
Tax History
| Year | Tax Paid | Tax Assessment Tax Assessment Total Assessment is a certain percentage of the fair market value that is determined by local assessors to be the total taxable value of land and additions on the property. | Land | Improvement |
|---|---|---|---|---|
| 2024 | $975 | $40,908 | $5,200 | $35,708 |
| 2023 | $975 | $38,218 | $5,200 | $33,018 |
| 2022 | $1,166 | $40,515 | $5,200 | $35,315 |
| 2021 | $1,200 | $40,515 | $5,200 | $35,315 |
| 2020 | $1,226 | $40,515 | $5,200 | $35,315 |
| 2019 | $1,225 | $40,515 | $5,200 | $35,315 |
| 2018 | $1,241 | $40,515 | $5,200 | $35,315 |
| 2017 | $1,250 | $40,515 | $5,200 | $35,315 |
| 2016 | $1,248 | $40,515 | $5,200 | $35,315 |
| 2015 | -- | $40,515 | $5,200 | $35,315 |
| 2014 | $1,165 | $40,515 | $5,200 | $35,315 |
Source: Public Records
Map
Nearby Homes
- 1703 Largo Cir
- 1647 Fresno St
- 2713 Pineview Dr Unit A&B
- 2570 Marathon Dr
- 1 Pomona Cir
- 2400 Lowndes Dr
- 1724 Eli Place
- 2320 Barack Obama Blvd
- 2414 Deborah Dr
- 1739 Eli Place
- 2311 Lowndes Dr
- 1750 Almond Tree Place Unit A & B
- 2517 Deborah Dr
- 2310 Barack Obama Blvd
- 1852 Chestnut Dr
- 1761 Hyssop Crossing
- 1763 Eli Place
- 1642 Lexington Cir
- 1703 Leone Ave
- 1507 Leone Ave
- 1618 Euclid St
- 2512 Bailey Dr
- 2516 Bailey Dr
- 2508 Bailey Dr
- 2520 Bailey Dr
- 2504 Bailey Dr
- 1616 Euclid St
- 1623 Euclid St
- 2524 Bailey Dr
- 1621 Euclid St
- 1621 Euclid St
- 2500 Bailey Dr
- 2528 Bailey Dr
- 1701 Fellowship Dr
- 1709 Fresno St
- 1619 Euclid St
- 1614 Euclid St
- 2505 Bailey Dr
- 1707 Fresno St
- 2523 Bailey Dr