Estimated Value: $186,000 - $208,000
3
Beds
2
Baths
1,298
Sq Ft
$150/Sq Ft
Est. Value
About This Home
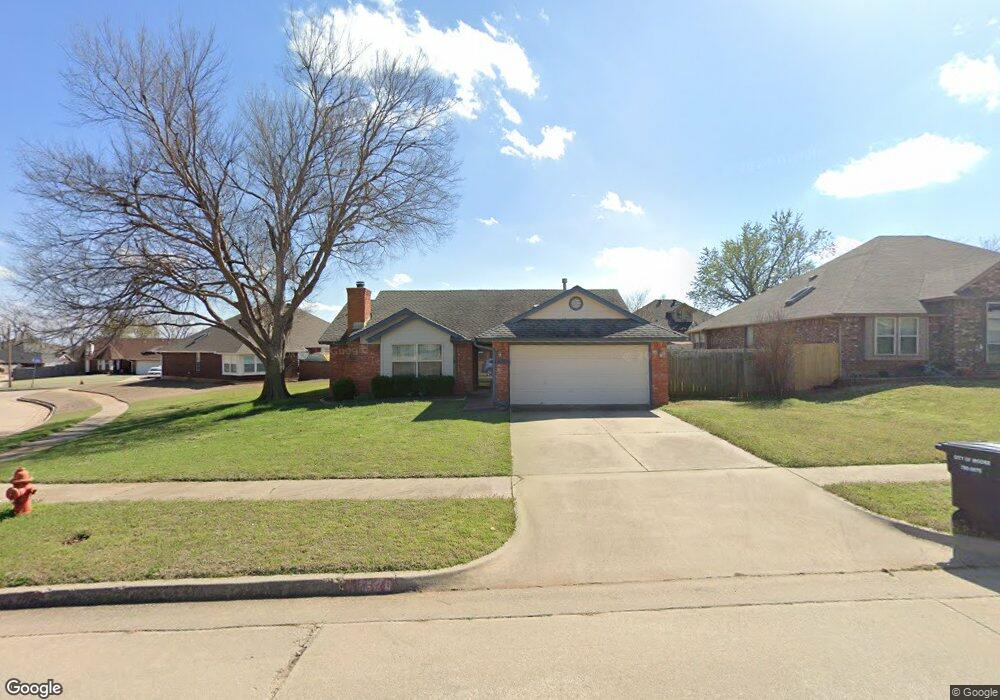
This home is located at 1620 NE 11th St, Moore, OK 73160 and is currently estimated at $194,455, approximately $149 per square foot. 1620 NE 11th St is a home located in Cleveland County with nearby schools including Winding Creek Elementary School, Central Junior High School, and Moore High School.
Ownership History
Date
Name
Owned For
Owner Type
Purchase Details
Closed on
Feb 26, 2024
Sold by
Bayles Todd Isaac
Bought by
Eleventh Street Investments Llc
Current Estimated Value
Purchase Details
Closed on
Jun 6, 2014
Sold by
Scott Shawn and Scott Jennevieve
Bought by
Bayles Todd Isaac
Purchase Details
Closed on
Dec 19, 2005
Sold by
Tootle Dannette L and Tootle Walter
Bought by
Scott Shawn and Scott Jennevieve
Home Financials for this Owner
Home Financials are based on the most recent Mortgage that was taken out on this home.
Original Mortgage
$80,600
Interest Rate
8.35%
Mortgage Type
Adjustable Rate Mortgage/ARM
Purchase Details
Closed on
Dec 13, 2005
Sold by
Tatum Gary and Tatum Gary L
Bought by
Tootle Dannette T and Tatum Dannette L
Home Financials for this Owner
Home Financials are based on the most recent Mortgage that was taken out on this home.
Original Mortgage
$80,600
Interest Rate
8.35%
Mortgage Type
Adjustable Rate Mortgage/ARM
Create a Home Valuation Report for This Property
The Home Valuation Report is an in-depth analysis detailing your home's value as well as a comparison with similar homes in the area
Home Values in the Area
Average Home Value in this Area
Purchase History
| Date | Buyer | Sale Price | Title Company |
|---|---|---|---|
| Eleventh Street Investments Llc | -- | None Listed On Document | |
| Bayles Todd Isaac | $1,800 | None Available | |
| Scott Shawn | $101,000 | None Available | |
| Tootle Dannette T | -- | None Available |
Source: Public Records
Mortgage History
| Date | Status | Borrower | Loan Amount |
|---|---|---|---|
| Previous Owner | Scott Shawn | $80,600 |
Source: Public Records
Tax History Compared to Growth
Tax History
| Year | Tax Paid | Tax Assessment Tax Assessment Total Assessment is a certain percentage of the fair market value that is determined by local assessors to be the total taxable value of land and additions on the property. | Land | Improvement |
|---|---|---|---|---|
| 2024 | $1,682 | $13,856 | $3,158 | $10,698 |
| 2023 | $1,608 | $13,196 | $2,932 | $10,264 |
| 2022 | $1,555 | $12,568 | $2,910 | $9,658 |
| 2021 | $1,488 | $11,969 | $2,400 | $9,569 |
| 2020 | $1,487 | $11,969 | $2,400 | $9,569 |
| 2019 | $1,516 | $11,969 | $2,400 | $9,569 |
| 2018 | $1,516 | $11,970 | $2,400 | $9,570 |
| 2017 | $1,524 | $11,970 | $0 | $0 |
| 2016 | $1,535 | $11,970 | $2,400 | $9,570 |
| 2015 | $1,388 | $11,970 | $2,400 | $9,570 |
| 2014 | $1,361 | $11,460 | $1,423 | $10,037 |
Source: Public Records
Map
Nearby Homes
- 1105 Oak Creek Dr
- 1401 NE 11th St
- 0 NE 12th St
- 1824 NE 11th St
- 920 Elm Creek Dr
- 2105 NE 11th St
- 1317 Washington Cir
- 1200 NE 5th St
- 609 Madeline Ln
- 1701 Heritage Cir
- 2224 NE 8th St
- 1404 Old Mill Rd
- 1109 David Rd
- 913 N Avery Dr
- 604 Loyd Ln
- 901 N Avery Dr
- 1100 David Rd
- 1109 E Hills Dr
- 1800 N Lincoln Ave
- 112 Wellington Ln
- 1616 NE 11th St
- 1625 NE 10th St
- 1621 NE 10th St
- 1612 NE 11th St
- 1617 NE 10th St
- 1621 NE 11th St
- 1104 Stadium Rd
- 1617 NE 11th St
- 1100 Stadium Rd
- 1613 NE 10th St
- 1608 NE 11th St
- 1613 NE 11th St
- 1200 Stadium Rd
- 1036 Stadium Rd
- 1609 NE 10th St
- 1609 NE 11th St
- 1604 NE 11th St
- 1632 NE 10th St
- 1620 NE 10th St
- 1628 NE 10th St