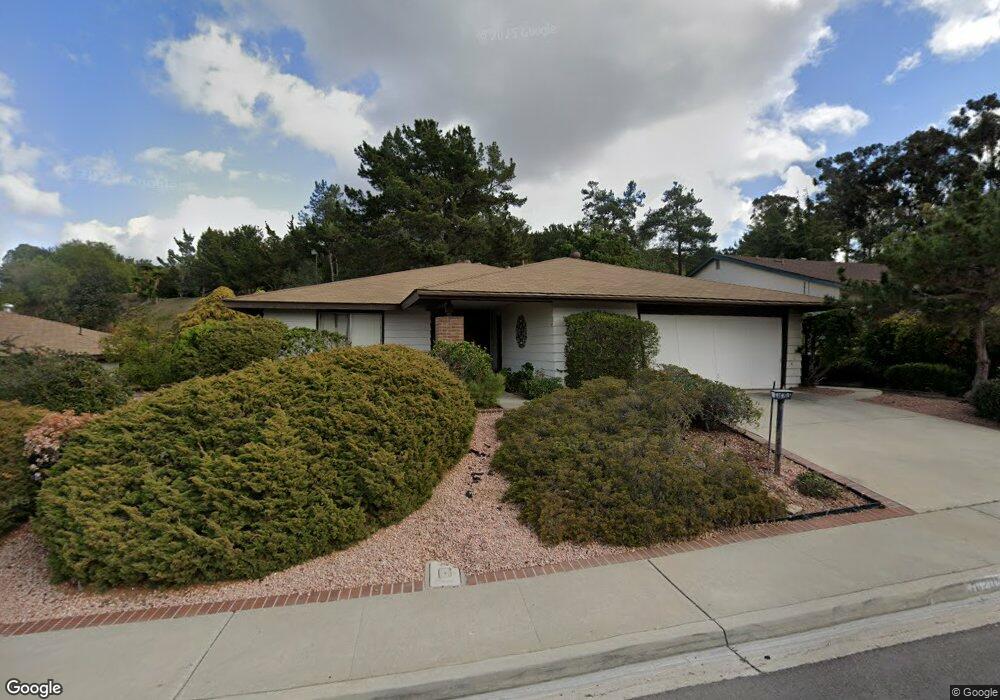
16205 Selva Dr San Diego, CA 92128
Rancho Bernardo NeighborhoodEstimated Value: $957,922 - $1,035,000
2
Beds
2
Baths
1,770
Sq Ft
$567/Sq Ft
Est. Value
About This Home
This home is located at 16205 Selva Dr, San Diego, CA 92128 and is currently estimated at $1,004,231, approximately $567 per square foot. 16205 Selva Dr is a home located in San Diego County with nearby schools including Highland Ranch Elementary School, Bernardo Heights Middle, and Rancho Bernardo High.
Ownership History
Date
Name
Owned For
Owner Type
Purchase Details
Closed on
Apr 25, 2025
Sold by
Tubao Joel J
Bought by
Joel And Anne-Marie Tubao Family Trust and Tubao
Current Estimated Value
Home Financials for this Owner
Home Financials are based on the most recent Mortgage that was taken out on this home.
Original Mortgage
$585,000
Outstanding Balance
$582,928
Interest Rate
6.65%
Mortgage Type
New Conventional
Estimated Equity
$421,303
Purchase Details
Closed on
Dec 9, 2005
Sold by
Tubao Joel J and Tubao Anne Marie E
Bought by
The Joel & Anne Marie Tubao Family Trust
Purchase Details
Closed on
Aug 20, 2003
Sold by
Brand Helen Norton
Bought by
Tubao Joel J and Tubao Anne Marie E
Home Financials for this Owner
Home Financials are based on the most recent Mortgage that was taken out on this home.
Original Mortgage
$319,000
Interest Rate
5.98%
Mortgage Type
Credit Line Revolving
Create a Home Valuation Report for This Property
The Home Valuation Report is an in-depth analysis detailing your home's value as well as a comparison with similar homes in the area
Home Values in the Area
Average Home Value in this Area
Purchase History
| Date | Buyer | Sale Price | Title Company |
|---|---|---|---|
| Joel And Anne-Marie Tubao Family Trust | -- | Chicago Title | |
| Tubao Joel J | -- | Chicago Title | |
| Tubao Joel J | -- | Chicago Title | |
| The Joel & Anne Marie Tubao Family Trust | -- | -- | |
| Tubao Joel J | $362,000 | California Title Company |
Source: Public Records
Mortgage History
| Date | Status | Borrower | Loan Amount |
|---|---|---|---|
| Open | Tubao Joel J | $585,000 | |
| Previous Owner | Tubao Joel J | $319,000 |
Source: Public Records
Tax History Compared to Growth
Tax History
| Year | Tax Paid | Tax Assessment Tax Assessment Total Assessment is a certain percentage of the fair market value that is determined by local assessors to be the total taxable value of land and additions on the property. | Land | Improvement |
|---|---|---|---|---|
| 2025 | $5,626 | $504,727 | $284,355 | $220,372 |
| 2024 | $5,626 | $494,831 | $278,780 | $216,051 |
| 2023 | $5,507 | $485,129 | $273,314 | $211,815 |
| 2022 | $5,416 | $475,617 | $267,955 | $207,662 |
| 2021 | $5,346 | $466,292 | $262,701 | $203,591 |
| 2020 | $5,274 | $461,512 | $260,008 | $201,504 |
| 2019 | $5,137 | $452,463 | $254,910 | $197,553 |
| 2018 | $4,994 | $443,592 | $249,912 | $193,680 |
| 2017 | $83 | $434,895 | $245,012 | $189,883 |
| 2016 | $4,761 | $426,368 | $240,208 | $186,160 |
| 2015 | $4,691 | $419,964 | $236,600 | $183,364 |
| 2014 | $4,581 | $411,739 | $231,966 | $179,773 |
Source: Public Records
Map
Nearby Homes
- 16182 Selva Dr
- 12486 Lomica Dr
- 15945 Avenida Villaha Unit 32
- 12494 Senda Rd
- 12640 Mantilla Rd
- 16021 Pomerado Rd
- 15913 Avenida Villaha Unit 42
- 12532 Paseo Lucido Unit 144
- 12365 Horado Rd
- 16422 Roca Dr
- 16413 Roca Dr
- 12257 Avenida Consentido
- 15662 Caminito la Torre
- 16498 Roca Dr
- 16515 Felice Dr
- 15818 Caminito Aire Puro
- 16421 Ramada Dr
- 12821 Avenida la Valencia
- 12215 Rios Rd
- 12830 Avenida la Valencia
- 16197 Selva Dr
- 16213 Selva Dr
- 16191 Selva Dr
- 16204 Selva Dr
- 16216 Selva Dr
- 16198 Selva Dr
- 12504 Avenida Tineo
- 16224 Selva Dr
- 12510 Avenida Tineo
- 16233 Selva Dr
- 16190 Selva Dr
- 16232 Selva Dr
- 12505 Avenida Tineo
- 16211 Pablo Dr
- 12516 Avenida Tineo
- 16221 Pablo Dr
- 12511 Avenida Tineo
- 16231 Pablo Dr
- 16181 Selva Dr
- 16240 Selva Dr