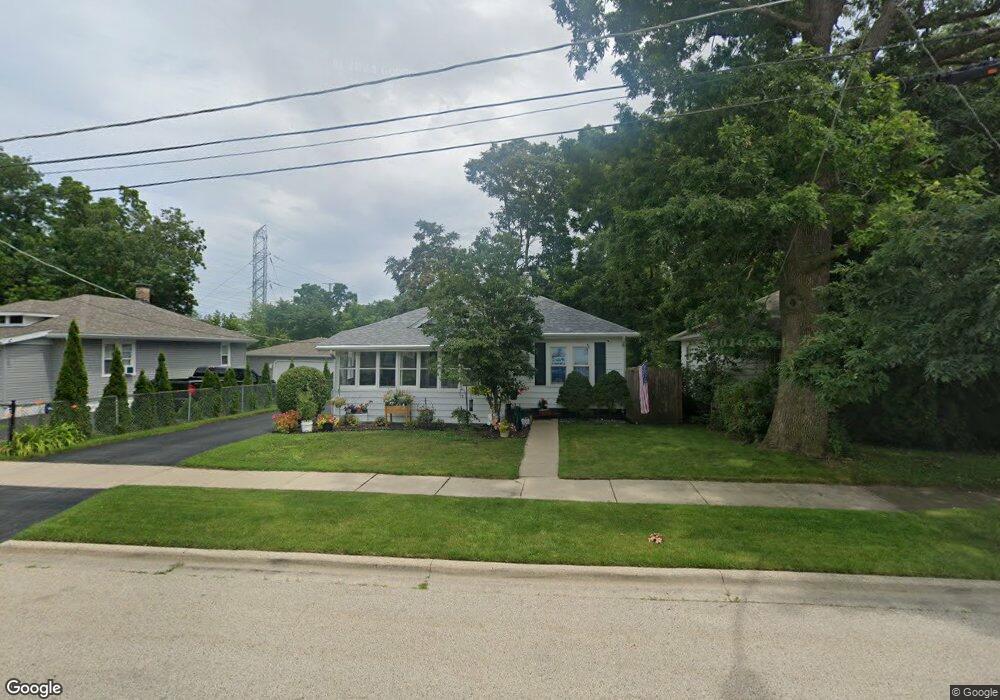
1621 Circle Ct Waukegan, IL 60085
Estimated Value: $217,642 - $238,000
3
Beds
1
Bath
1,050
Sq Ft
$218/Sq Ft
Est. Value
About This Home
This home is located at 1621 Circle Ct, Waukegan, IL 60085 and is currently estimated at $228,411, approximately $217 per square foot. 1621 Circle Ct is a home located in Lake County with nearby schools including Greenwood Elementary School, Edith M Smith Middle School, and Waukegan High School.
Ownership History
Date
Name
Owned For
Owner Type
Purchase Details
Closed on
Jul 17, 2001
Sold by
Dhyani Pranay and Dhyani Sejal
Bought by
Carlson Debra A
Current Estimated Value
Home Financials for this Owner
Home Financials are based on the most recent Mortgage that was taken out on this home.
Original Mortgage
$118,328
Interest Rate
7.15%
Mortgage Type
FHA
Purchase Details
Closed on
Jun 28, 1996
Sold by
Montano Sergio L and Montano Judy M
Bought by
Dhyani Pranay
Home Financials for this Owner
Home Financials are based on the most recent Mortgage that was taken out on this home.
Original Mortgage
$87,372
Interest Rate
8.13%
Mortgage Type
FHA
Purchase Details
Closed on
Nov 3, 1994
Sold by
Sandahl David T and Sandahl Leslie A
Bought by
Montano Sergio L and Montano Judy M
Home Financials for this Owner
Home Financials are based on the most recent Mortgage that was taken out on this home.
Original Mortgage
$86,700
Interest Rate
8.91%
Mortgage Type
Assumption
Create a Home Valuation Report for This Property
The Home Valuation Report is an in-depth analysis detailing your home's value as well as a comparison with similar homes in the area
Home Values in the Area
Average Home Value in this Area
Purchase History
| Date | Buyer | Sale Price | Title Company |
|---|---|---|---|
| Carlson Debra A | $120,000 | -- | |
| Dhyani Pranay | $95,000 | -- | |
| Montano Sergio L | $85,000 | -- |
Source: Public Records
Mortgage History
| Date | Status | Borrower | Loan Amount |
|---|---|---|---|
| Open | Carlson Debra A | $35,000 | |
| Closed | Carlson Debra A | $60,000 | |
| Closed | Carlson Debra A | $122,003 | |
| Closed | Carlson Debra A | $118,328 | |
| Previous Owner | Dhyani Pranay | $83,848 | |
| Previous Owner | Dhyani Pranay | $87,372 | |
| Previous Owner | Montano Sergio L | $86,700 |
Source: Public Records
Tax History Compared to Growth
Tax History
| Year | Tax Paid | Tax Assessment Tax Assessment Total Assessment is a certain percentage of the fair market value that is determined by local assessors to be the total taxable value of land and additions on the property. | Land | Improvement |
|---|---|---|---|---|
| 2024 | $4,075 | $54,962 | $8,586 | $46,376 |
| 2023 | $3,181 | $48,765 | $7,618 | $41,147 |
| 2022 | $3,181 | $38,543 | $5,621 | $32,922 |
| 2021 | $2,830 | $33,142 | $4,836 | $28,306 |
| 2020 | $2,820 | $30,875 | $4,505 | $26,370 |
| 2019 | $2,785 | $28,292 | $4,128 | $24,164 |
| 2018 | $2,476 | $25,532 | $5,843 | $19,689 |
| 2017 | $2,377 | $22,588 | $5,169 | $17,419 |
| 2016 | $2,106 | $19,628 | $4,492 | $15,136 |
| 2015 | $1,954 | $17,567 | $4,020 | $13,547 |
| 2014 | $2,681 | $21,387 | $5,342 | $16,045 |
| 2012 | $3,543 | $23,171 | $5,787 | $17,384 |
Source: Public Records
Map
Nearby Homes
- 1613 North Ave
- 616 W Keith Ave
- 1336 N Ash St
- 1335 Chestnut St
- 2213 Alta Vista Dr
- 415 W Ridgeland Ave
- 1122 N Ash St
- 1110 N Ash St
- 2246 Alta Vista Dr
- 1018 W Atlantic Ave
- 1905 Linden Ave
- 723 N County St
- 918 N Ash St
- 1312 N Linden Ave
- 325 4th St
- 611 N Genesee St
- 1105 Woodlawn Cir
- 2232 Walnut St
- 301 W Eagle Ct
- 0 Traditions Dr
- 1627 Circle Ct
- 1619 Circle Ct
- 1611 Circle Ct
- 1701 Circle Ct
- 103 E Keith Ave
- 1709 Circle Ct
- 1605 Circle Ct
- 1608 Circle Ct
- 105 E Keith Ave
- 1711 Circle Ct
- 104 E Keith Ave
- 1601 Circle Ct
- 111 E Keith Ave
- 106 E Keith Ave
- 112 E Keith Ave
- 1600 Circle Ct
- 116 Harding Ave
- 115 E Keith Ave
- 1529 Circle Ct
- 116 E Keith Ave