Estimated Value: $264,000 - $312,000
3
Beds
3
Baths
1,162
Sq Ft
$245/Sq Ft
Est. Value
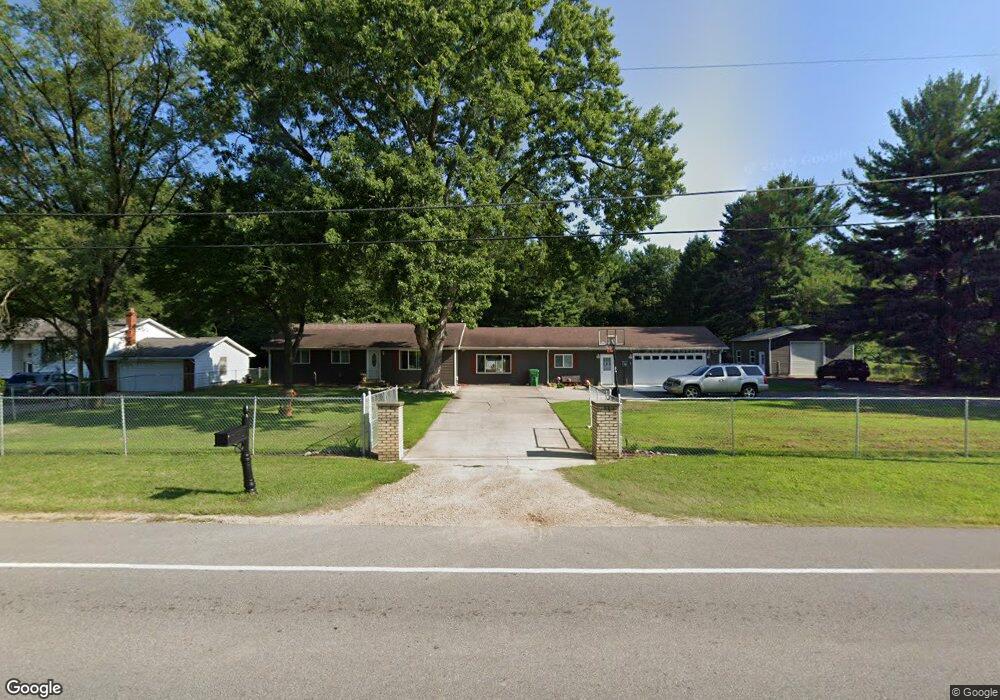
About This Home
This home is located at 1621 E Bertrand Rd, Niles, MI 49120 and is currently estimated at $284,846, approximately $245 per square foot. 1621 E Bertrand Rd is a home located in Berrien County with nearby schools including Merritt Elementary School, Brandywine Elementary School, and Brandywine Middle School.
Ownership History
Date
Name
Owned For
Owner Type
Purchase Details
Closed on
Nov 2, 2023
Sold by
Knoll Erin Nicole
Bought by
Linley Bradley Scott
Current Estimated Value
Purchase Details
Closed on
May 10, 2011
Sold by
Fannie Mae
Bought by
Linley Brad and Linley Erin
Purchase Details
Closed on
Apr 30, 2010
Sold by
Bac Home Loans Servicing Lp
Bought by
Federal National Mortgage Association
Purchase Details
Closed on
Mar 25, 2010
Sold by
Brekke Aaron L
Bought by
Bac Home Loans Servicing Lp
Purchase Details
Closed on
Dec 20, 2006
Sold by
Brekke Christy D
Bought by
Brekke Aaron L
Purchase Details
Closed on
Jan 5, 2006
Sold by
Hall David L and Hall Wanda L
Bought by
Household Finance Corp
Purchase Details
Closed on
Jul 15, 1988
Purchase Details
Closed on
Aug 11, 1982
Purchase Details
Closed on
Sep 23, 1977
Create a Home Valuation Report for This Property
The Home Valuation Report is an in-depth analysis detailing your home's value as well as a comparison with similar homes in the area
Home Values in the Area
Average Home Value in this Area
Purchase History
| Date | Buyer | Sale Price | Title Company |
|---|---|---|---|
| Linley Bradley Scott | -- | None Listed On Document | |
| Linley Bradley Scott | -- | None Listed On Document | |
| Linley Brad | $30,000 | Attorneys Title Agency Llc | |
| Federal National Mortgage Association | -- | None Available | |
| Bac Home Loans Servicing Lp | $75,948 | None Available | |
| Brekke Aaron L | -- | None Available | |
| Household Finance Corp | $104,880 | None Available | |
| -- | $53,500 | -- | |
| -- | $100 | -- | |
| -- | $18,500 | -- |
Source: Public Records
Tax History
| Year | Tax Paid | Tax Assessment Tax Assessment Total Assessment is a certain percentage of the fair market value that is determined by local assessors to be the total taxable value of land and additions on the property. | Land | Improvement |
|---|---|---|---|---|
| 2025 | $2,525 | $149,200 | $0 | $0 |
| 2024 | $1,429 | $122,100 | $0 | $0 |
| 2023 | $1,362 | $110,400 | $0 | $0 |
| 2022 | $1,303 | $100,100 | $0 | $0 |
| 2021 | $2,168 | $77,900 | $9,000 | $68,900 |
| 2020 | $2,150 | $72,700 | $0 | $0 |
| 2019 | $2,066 | $63,500 | $9,000 | $54,500 |
| 2018 | $1,994 | $63,500 | $0 | $0 |
| 2017 | $1,980 | $60,000 | $0 | $0 |
| 2016 | $1,954 | $57,700 | $0 | $0 |
| 2015 | $1,893 | $58,300 | $0 | $0 |
| 2014 | $1,119 | $56,100 | $0 | $0 |
Source: Public Records
Map
Nearby Homes
- 2711 Sugarberry Ln
- 2723 Sugarberry Ln
- 2801 Primrose Ct
- 1355 Honeysuckle Ln
- 1404 Mould Ave
- 2807 S 13th St
- 2428 S 14th St
- VL Fulkerson Rd
- 2420 Floral Dr
- 2006 Ontario Rd Unit 141
- 2325 Fair Oaks St E
- 321 E Bertrand Rd
- 70700 Ironwood Dr
- 2639 S 3rd St
- 70668 Edison St
- 242 Higgins St
- 3120 Woodlawn St
- 1109 Stateline Rd
- 19075 Dresden Dr
- 2142 S 11 Th St
- 1619 E Bertrand Rd
- 1622 E Bertrand Rd
- 1616 E Bertrand Rd
- 1615 E Bertrand Rd
- 1612 E Bertrand Rd
- 1611 E Bertrand Rd
- 1660 E Bertrand Rd
- 2650 S 17th St
- 1606 E Bertrand Rd
- 1602 E Bertrand Rd
- 2646 S 17th St
- 2629 S 16th St
- 2635 S 16th St
- 1630 Mould Ave
- 1632 Mould Ave
- 1706 E Bertrand Rd
- 1634 Mould Ave
- 1628 Mould Ave
- 2711 East St
- 1710 E Bertrand Rd
Your Personal Tour Guide
Ask me questions while you tour the home.