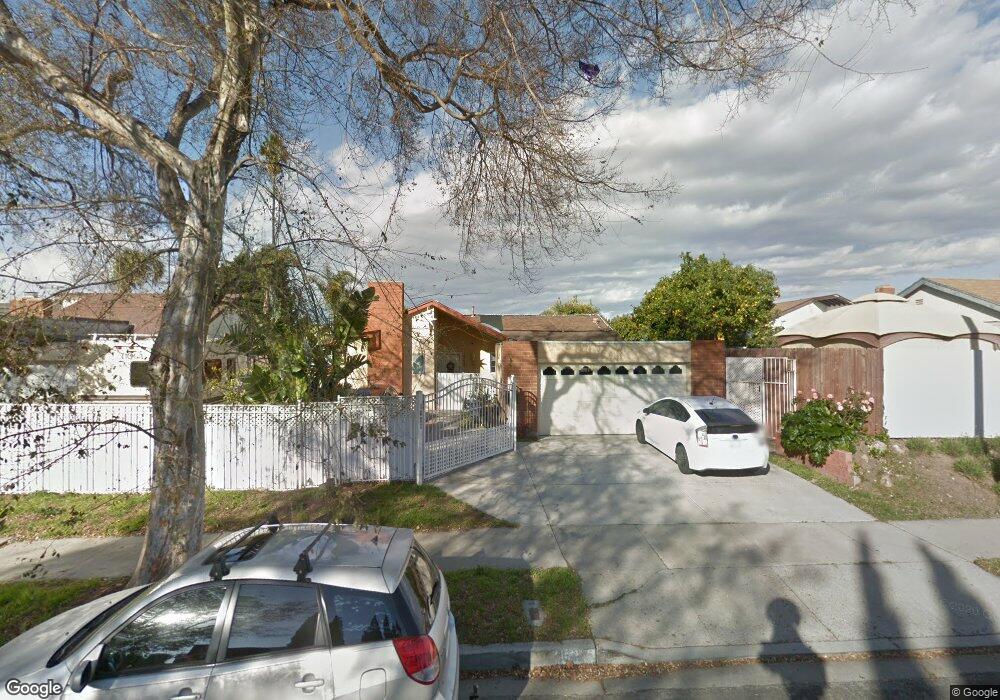
1621 Hill St Oxnard, CA 93035
Marina West NeighborhoodEstimated Value: $620,000 - $780,701
4
Beds
2
Baths
1,548
Sq Ft
$473/Sq Ft
Est. Value
About This Home
This home is located at 1621 Hill St, Oxnard, CA 93035 and is currently estimated at $731,925, approximately $472 per square foot. 1621 Hill St is a home located in Ventura County with nearby schools including Marina West Elementary School and Oxnard High School.
Ownership History
Date
Name
Owned For
Owner Type
Purchase Details
Closed on
May 26, 2011
Sold by
Solis Patric Manzon
Bought by
Mendoza Maria Theresa
Current Estimated Value
Purchase Details
Closed on
Mar 29, 2005
Sold by
Mendoza Maria Theresa and Solis Patric Manzon
Bought by
Solis Patric Manzon and Mendoza Maria Theresa
Home Financials for this Owner
Home Financials are based on the most recent Mortgage that was taken out on this home.
Original Mortgage
$424,000
Outstanding Balance
$217,664
Interest Rate
5.7%
Mortgage Type
New Conventional
Estimated Equity
$514,261
Purchase Details
Closed on
Aug 29, 2000
Sold by
Quintero Jamie E and Quintero Mary Y
Bought by
Mendoza Maria Theresa and Solis Patric Manzon
Home Financials for this Owner
Home Financials are based on the most recent Mortgage that was taken out on this home.
Original Mortgage
$227,900
Interest Rate
7.96%
Create a Home Valuation Report for This Property
The Home Valuation Report is an in-depth analysis detailing your home's value as well as a comparison with similar homes in the area
Home Values in the Area
Average Home Value in this Area
Purchase History
| Date | Buyer | Sale Price | Title Company |
|---|---|---|---|
| Mendoza Maria Theresa | -- | None Available | |
| Solis Patric Manzon | -- | Chicago Title Co | |
| Mendoza Maria Theresa | $228,000 | Stewart Title |
Source: Public Records
Mortgage History
| Date | Status | Borrower | Loan Amount |
|---|---|---|---|
| Open | Solis Patric Manzon | $424,000 | |
| Closed | Mendoza Maria Theresa | $227,900 |
Source: Public Records
Tax History
| Year | Tax Paid | Tax Assessment Tax Assessment Total Assessment is a certain percentage of the fair market value that is determined by local assessors to be the total taxable value of land and additions on the property. | Land | Improvement |
|---|---|---|---|---|
| 2025 | $4,106 | $343,527 | $137,407 | $206,120 |
| 2024 | $4,106 | $336,792 | $134,713 | $202,079 |
| 2023 | $3,955 | $330,189 | $132,072 | $198,117 |
| 2022 | $3,835 | $323,715 | $129,482 | $194,233 |
| 2021 | $3,803 | $317,368 | $126,943 | $190,425 |
| 2020 | $3,873 | $314,116 | $125,643 | $188,473 |
| 2019 | $3,762 | $307,958 | $123,180 | $184,778 |
| 2018 | $3,708 | $301,920 | $120,765 | $181,155 |
| 2017 | $3,519 | $296,001 | $118,398 | $177,603 |
| 2016 | $3,395 | $290,198 | $116,077 | $174,121 |
| 2015 | $3,429 | $285,841 | $114,335 | $171,506 |
| 2014 | $3,390 | $280,245 | $112,097 | $168,148 |
Source: Public Records
Map
Nearby Homes
- 1501 Pisco Ln
- 2213 Miramar Walk
- 2324 Miramar Walk
- 1174 Oyster Place Unit 15
- 257 E Garden Green
- 1309 Nautical Way
- 137 E Garden Green
- 1231 Lost Point Ln
- 13 W Garden Green
- 807 Kingfisher Way
- 269 E Elfin Green
- 1030 Ilena St
- 1720 Elsinore Cir
- 2400 W Hemlock St
- 75 W Fiesta Green
- 236 E Bay Blvd
- 2736 Jill Place Unit B
- 2730 Jill Place
- 31 W Delta Green
- 2900 Windward Way
Your Personal Tour Guide
Ask me questions while you tour the home.