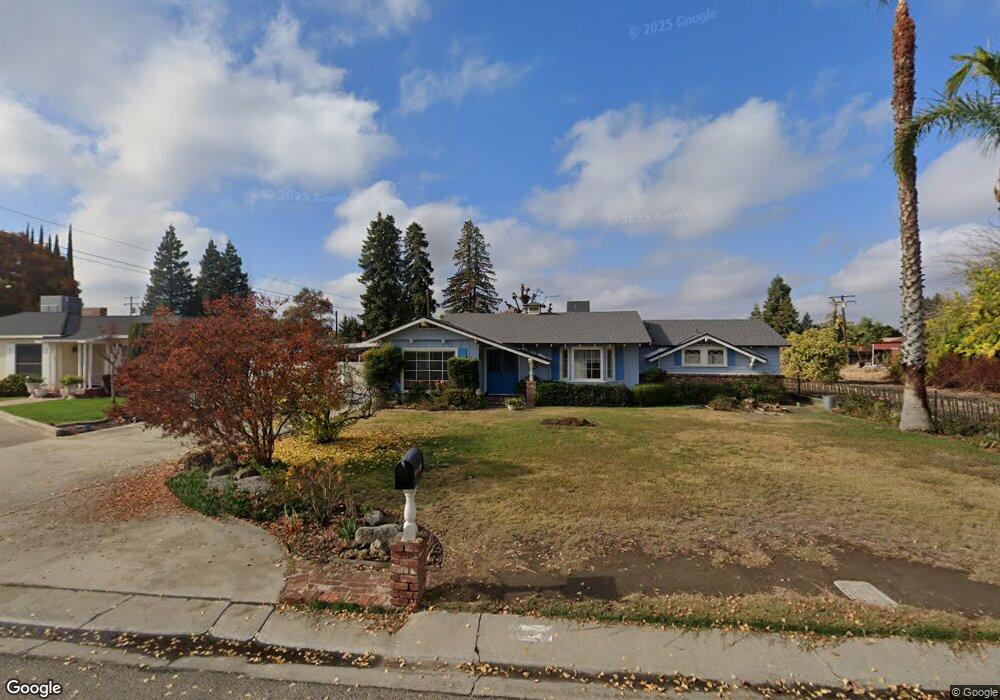
1621 S Chinowth St Visalia, CA 93277
Estimated Value: $382,113 - $424,000
3
Beds
2
Baths
1,931
Sq Ft
$209/Sq Ft
Est. Value
About This Home
This home is located at 1621 S Chinowth St, Visalia, CA 93277 and is currently estimated at $403,778, approximately $209 per square foot. 1621 S Chinowth St is a home located in Tulare County with nearby schools including Veva Blunt Elementary School, La Joya Middle School, and El Diamante High School.
Ownership History
Date
Name
Owned For
Owner Type
Purchase Details
Closed on
Aug 21, 2003
Sold by
Carroll Mitchell
Bought by
Carroll Mitchell and Carroll Jesusa
Current Estimated Value
Home Financials for this Owner
Home Financials are based on the most recent Mortgage that was taken out on this home.
Original Mortgage
$84,074
Interest Rate
5.46%
Mortgage Type
Purchase Money Mortgage
Purchase Details
Closed on
May 6, 1996
Sold by
Bostedt R A
Bought by
Carroll Mitchell and Carroll Jesusa
Home Financials for this Owner
Home Financials are based on the most recent Mortgage that was taken out on this home.
Original Mortgage
$85,000
Interest Rate
7.96%
Purchase Details
Closed on
Mar 28, 1996
Sold by
Bostedt William R
Bought by
Bostedt R A
Home Financials for this Owner
Home Financials are based on the most recent Mortgage that was taken out on this home.
Original Mortgage
$85,000
Interest Rate
7.96%
Purchase Details
Closed on
Mar 30, 1994
Sold by
Bostedt R A
Bought by
Bostedt William R and Bostedt Thomas R
Create a Home Valuation Report for This Property
The Home Valuation Report is an in-depth analysis detailing your home's value as well as a comparison with similar homes in the area
Home Values in the Area
Average Home Value in this Area
Purchase History
| Date | Buyer | Sale Price | Title Company |
|---|---|---|---|
| Carroll Mitchell | -- | Placer Title Company | |
| Carroll Mitchell | $125,000 | Chicago Title Co | |
| Bostedt R A | -- | Chicago Title Co | |
| Bostedt R A | -- | Chicago Title Co | |
| Bostedt R A | -- | Chicago Title Co | |
| Bostedt William R | -- | -- |
Source: Public Records
Mortgage History
| Date | Status | Borrower | Loan Amount |
|---|---|---|---|
| Previous Owner | Carroll Mitchell | $84,074 | |
| Previous Owner | Carroll Mitchell | $85,000 | |
| Closed | Carroll Mitchell | $20,000 |
Source: Public Records
Tax History Compared to Growth
Tax History
| Year | Tax Paid | Tax Assessment Tax Assessment Total Assessment is a certain percentage of the fair market value that is determined by local assessors to be the total taxable value of land and additions on the property. | Land | Improvement |
|---|---|---|---|---|
| 2025 | $2,221 | $217,570 | $65,213 | $152,357 |
| 2024 | $2,221 | $213,305 | $63,935 | $149,370 |
| 2023 | $2,158 | $209,124 | $62,682 | $146,442 |
| 2022 | $2,061 | $205,024 | $61,453 | $143,571 |
| 2021 | $2,062 | $201,004 | $60,248 | $140,756 |
| 2020 | $2,044 | $198,943 | $59,630 | $139,313 |
| 2019 | $1,984 | $195,042 | $58,461 | $136,581 |
| 2018 | $1,932 | $191,218 | $57,315 | $133,903 |
| 2017 | $1,911 | $187,468 | $56,191 | $131,277 |
| 2016 | $1,874 | $183,792 | $55,089 | $128,703 |
| 2015 | $1,818 | $181,032 | $54,262 | $126,770 |
| 2014 | $1,818 | $177,486 | $53,199 | $124,287 |
Source: Public Records
Map
Nearby Homes
- 1633 S Chinowth St
- 4024 W Howard Ave
- 4438 W Feemster Ave
- 3708 W Paradise Ave
- 4527 W Iris Ave
- 3924 W Fairhaven Ave
- 4615 W Feemster Ave
- 4614 W Howard Ave
- 1937 S Royal Oaks Dr
- 3507 W Howard Ave
- 3515 W Iris Ave
- 4737 W Iris Ave
- 4747 W Iris Ave
- 849 S Cindy St
- 1233 S Kent St
- 820 S Chinowth St Unit 93
- 820 S Chinowth St Unit 72
- 820 S Chinowth St
- 820 S Chinowth St Unit 98
- 820 S Chinowth St Unit 102
- 1633 S Chinowth St Unit 1, 2,3
- 4138 W Judy Ave
- 1545 S Chinowth St
- 4200 W Judy Ave
- 4043 W Paradise Ave
- 1640 S Chinowth St
- 4224 W Judy Ave
- 4035 W Paradise Ave
- 4044 W Paradise Ave
- 4141 W Judy Ave
- 1715 S Chinowth St
- 4034 W Judy Ave
- 4145 W Judy Ave
- 4121 W Feemster Ave
- 4147 W Judy Ave
- 4139 W Feemster Ave
- 1720 S Chinowth St
- 4036 W Paradise Ave
- 4238 W Judy Ave
- 4021 W Paradise Ave