Estimated Value: $162,318 - $188,000
3
Beds
1
Bath
1,314
Sq Ft
$136/Sq Ft
Est. Value
About This Home
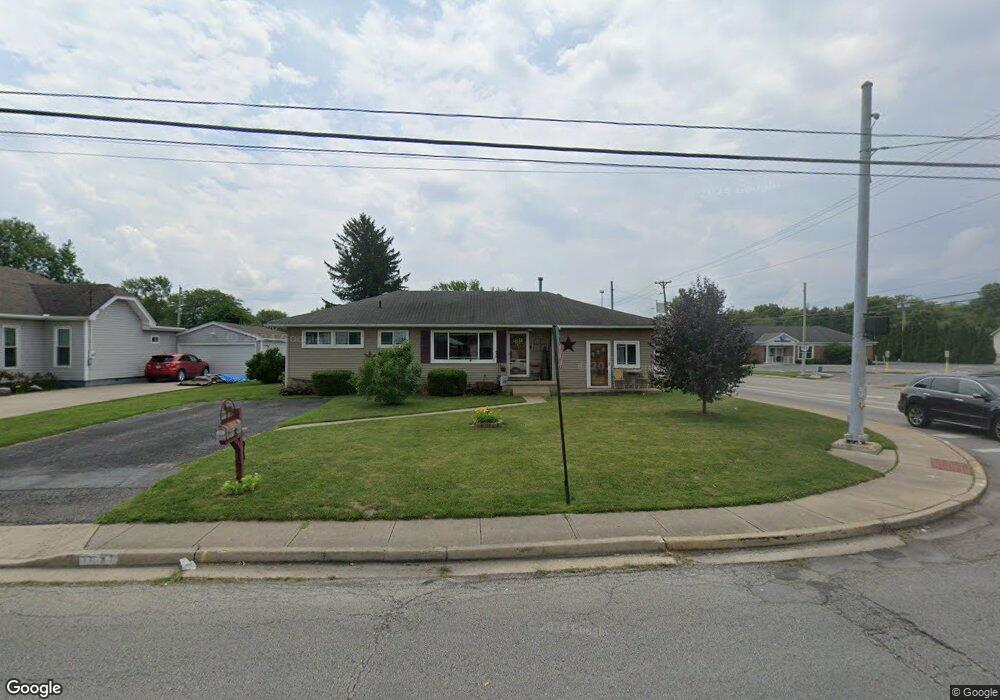
This home is located at 1621 W High St, Piqua, OH 45356 and is currently estimated at $178,080, approximately $135 per square foot. 1621 W High St is a home located in Miami County with nearby schools including Washington Primary School, Piqua Junior High School, and Piqua High School.
Ownership History
Date
Name
Owned For
Owner Type
Purchase Details
Closed on
Jun 2, 2015
Sold by
Yager Michael R and Yager Angela S
Bought by
Yager Michael R and Yager Angela S
Current Estimated Value
Purchase Details
Closed on
Nov 7, 2008
Sold by
Killian Carol L and Killian Michael C
Bought by
Yager Michael R
Home Financials for this Owner
Home Financials are based on the most recent Mortgage that was taken out on this home.
Original Mortgage
$79,550
Outstanding Balance
$52,296
Interest Rate
6.11%
Mortgage Type
VA
Estimated Equity
$125,784
Purchase Details
Closed on
Jul 17, 2007
Sold by
Haines William W
Bought by
Killian Carol L and Killian Michael C
Home Financials for this Owner
Home Financials are based on the most recent Mortgage that was taken out on this home.
Original Mortgage
$64,800
Interest Rate
6.42%
Mortgage Type
New Conventional
Purchase Details
Closed on
Jun 4, 2002
Sold by
Haines Delaphine G
Bought by
Haines William W and Haines Delaphine G
Purchase Details
Closed on
Jun 1, 1987
Bought by
Haines Delaphine G
Create a Home Valuation Report for This Property
The Home Valuation Report is an in-depth analysis detailing your home's value as well as a comparison with similar homes in the area
Home Values in the Area
Average Home Value in this Area
Purchase History
| Date | Buyer | Sale Price | Title Company |
|---|---|---|---|
| Yager Michael R | -- | Attorney | |
| Yager Michael R | $77,900 | -- | |
| Killian Carol L | $72,000 | -- | |
| Haines William W | -- | -- | |
| Haines Delaphine G | -- | -- |
Source: Public Records
Mortgage History
| Date | Status | Borrower | Loan Amount |
|---|---|---|---|
| Open | Haines William W | $79,550 | |
| Previous Owner | Haines William W | $64,800 |
Source: Public Records
Tax History Compared to Growth
Tax History
| Year | Tax Paid | Tax Assessment Tax Assessment Total Assessment is a certain percentage of the fair market value that is determined by local assessors to be the total taxable value of land and additions on the property. | Land | Improvement |
|---|---|---|---|---|
| 2024 | $1,503 | $36,580 | $8,680 | $27,900 |
| 2023 | $1,503 | $36,580 | $8,680 | $27,900 |
| 2022 | $1,529 | $36,580 | $8,680 | $27,900 |
| 2021 | $1,238 | $27,090 | $6,440 | $20,650 |
| 2020 | $1,214 | $27,090 | $6,440 | $20,650 |
| 2019 | $1,220 | $27,090 | $6,440 | $20,650 |
| 2018 | $1,116 | $23,660 | $6,440 | $17,220 |
| 2017 | $1,130 | $23,660 | $6,440 | $17,220 |
| 2016 | $1,117 | $23,660 | $6,440 | $17,220 |
| 2015 | $1,143 | $23,660 | $6,440 | $17,220 |
| 2014 | $1,143 | $23,660 | $6,440 | $17,220 |
| 2013 | $1,147 | $23,660 | $6,440 | $17,220 |
Source: Public Records
Map
Nearby Homes
- 210 Lyndhurst Dr
- 1235 Marwood Dr
- 1821 Wilshire Dr
- 1831 Wilshire Dr
- 1435 Covington Ave
- 215 Levering Dr
- 1271 Park Ave
- 513 Spotted Doe Trail
- 1200 W High St
- 1133 W Water St
- 1206 Echo Lake Dr
- 1050 Boone St
- 403 Brentwood Ave
- 817 Washington Ave
- 1038 Boone St
- 3 Lake Ridge Dr
- 0 Robert M Davis Pkwy
- 1119 Anderson St