1621 W Vartikian Ave Fresno, CA 93711
Bullard NeighborhoodEstimated Value: $581,698 - $647,000
4
Beds
3
Baths
2,800
Sq Ft
$214/Sq Ft
Est. Value
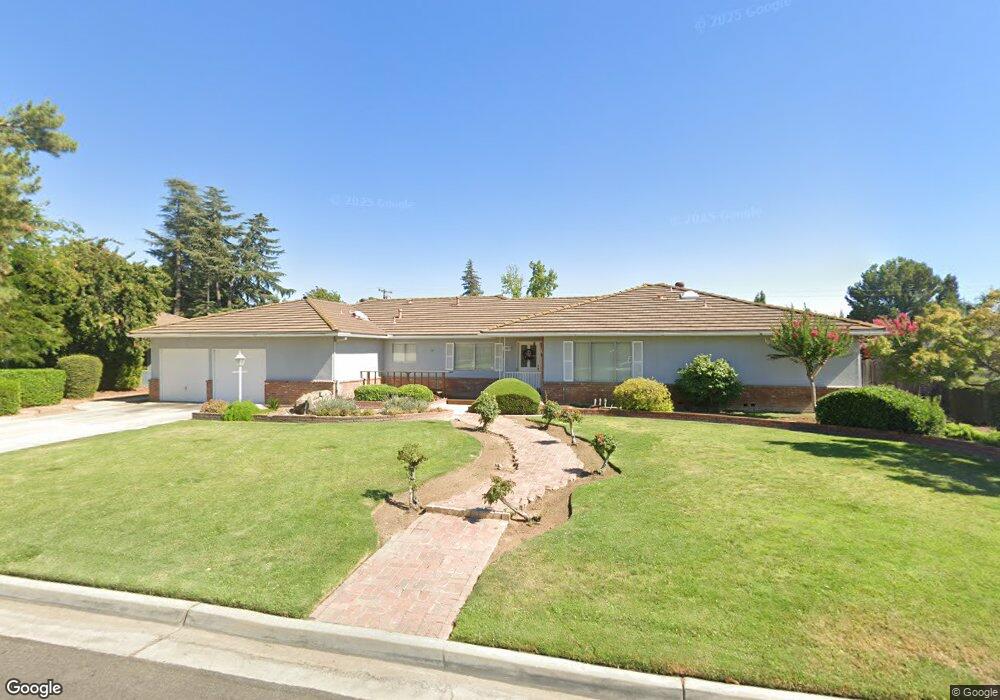
About This Home
This home is located at 1621 W Vartikian Ave, Fresno, CA 93711 and is currently estimated at $599,175, approximately $213 per square foot. 1621 W Vartikian Ave is a home located in Fresno County with nearby schools including Starr Elementary School, Tenaya Middle School, and Bullard High School.
Ownership History
Date
Name
Owned For
Owner Type
Purchase Details
Closed on
Apr 21, 2021
Sold by
Kemble Patrick J and Kemble Charlida M
Bought by
Kemble Patrick J and Kemble Charlida M
Current Estimated Value
Purchase Details
Closed on
Oct 4, 2010
Sold by
Gilman Richard W and Gilman Jane E
Bought by
Kemble Patrick J and Kemble Charlida M
Home Financials for this Owner
Home Financials are based on the most recent Mortgage that was taken out on this home.
Original Mortgage
$218,400
Outstanding Balance
$143,827
Interest Rate
4.31%
Mortgage Type
New Conventional
Estimated Equity
$455,348
Purchase Details
Closed on
Aug 16, 2004
Sold by
Gilman Richard W and Gilman Jane E
Bought by
Gilman Richard W and Gilman Jane E
Purchase Details
Closed on
Aug 27, 1997
Sold by
Titius Michael L and Titius Cynthia K
Bought by
Gilman Richard W and Gilman Jane E
Home Financials for this Owner
Home Financials are based on the most recent Mortgage that was taken out on this home.
Original Mortgage
$124,800
Interest Rate
7.26%
Create a Home Valuation Report for This Property
The Home Valuation Report is an in-depth analysis detailing your home's value as well as a comparison with similar homes in the area
Home Values in the Area
Average Home Value in this Area
Purchase History
| Date | Buyer | Sale Price | Title Company |
|---|---|---|---|
| Kemble Patrick J | -- | None Available | |
| Kemble Patrick J | $273,000 | Chicago Title Company | |
| Gilman Richard W | -- | -- | |
| Gilman Richard W | $156,000 | Central Title Company |
Source: Public Records
Mortgage History
| Date | Status | Borrower | Loan Amount |
|---|---|---|---|
| Open | Kemble Patrick J | $218,400 | |
| Previous Owner | Gilman Richard W | $124,800 |
Source: Public Records
Tax History Compared to Growth
Tax History
| Year | Tax Paid | Tax Assessment Tax Assessment Total Assessment is a certain percentage of the fair market value that is determined by local assessors to be the total taxable value of land and additions on the property. | Land | Improvement |
|---|---|---|---|---|
| 2025 | $4,172 | $349,750 | $83,270 | $266,480 |
| 2023 | $4,091 | $336,171 | $80,038 | $256,133 |
| 2022 | $4,034 | $329,580 | $78,469 | $251,111 |
| 2021 | $3,920 | $323,119 | $76,931 | $246,188 |
| 2020 | $3,903 | $319,807 | $76,143 | $243,664 |
| 2019 | $3,749 | $313,537 | $74,650 | $238,887 |
| 2018 | $3,666 | $307,390 | $73,187 | $234,203 |
| 2017 | $3,601 | $301,363 | $71,752 | $229,611 |
| 2016 | $3,479 | $295,455 | $70,346 | $225,109 |
| 2015 | $3,425 | $291,018 | $69,290 | $221,728 |
| 2014 | $3,357 | $285,318 | $67,933 | $217,385 |
Source: Public Records
Map
Nearby Homes
- 1590 W Escalon Ave
- 1611 W Escalon Ave
- 1654 W Vartikian Ave
- 1545 W Calimyrna Ave
- 1387 W Sample Ave
- 1709 W Calimyrna Ave Unit 9A
- 1702 W Bullard Ave Unit 105
- 2015 W Calimyrna Ave Unit 1A
- 2076 W Calimyrna Ave Unit 102
- 6447 N Vagedes Ave
- 2073 W Calimyrna Ave Unit 101
- 5740 N West Ave Unit 109
- 5740 N West Ave Unit 107
- 1486 W Roberts Ave
- 6569 N Teilman Ave
- 1232 W Mesa Ave
- 1229 W Bullard Ave Unit 105
- 6518 N Dolores Ave
- 5630 N El Adobe Dr
- 6043 N Forkner Ave
- 1637 W Vartikian Ave
- 1605 W Vartikian Ave
- 1620 W Escalon Ave
- 1604 W Escalon Ave
- 1620 W Vartikian Ave
- 1638 W Escalon Ave
- 1636 W Vartikian Ave
- 1653 W Vartikian Ave
- 6264 N Durant Ave
- 6276 N Durant Ave
- 1656 W Escalon Ave
- 1665 W Vartikian Ave
- 1631 W Ellery Way
- 1645 W Ellery Way
- 6257 N Teilman Ave
- 1672 W Vartikian Ave
- 6275 N Teilman Ave
- 6235 N Teilman Ave
- 1625 W Escalon Ave
- 1657 W Ellery Way