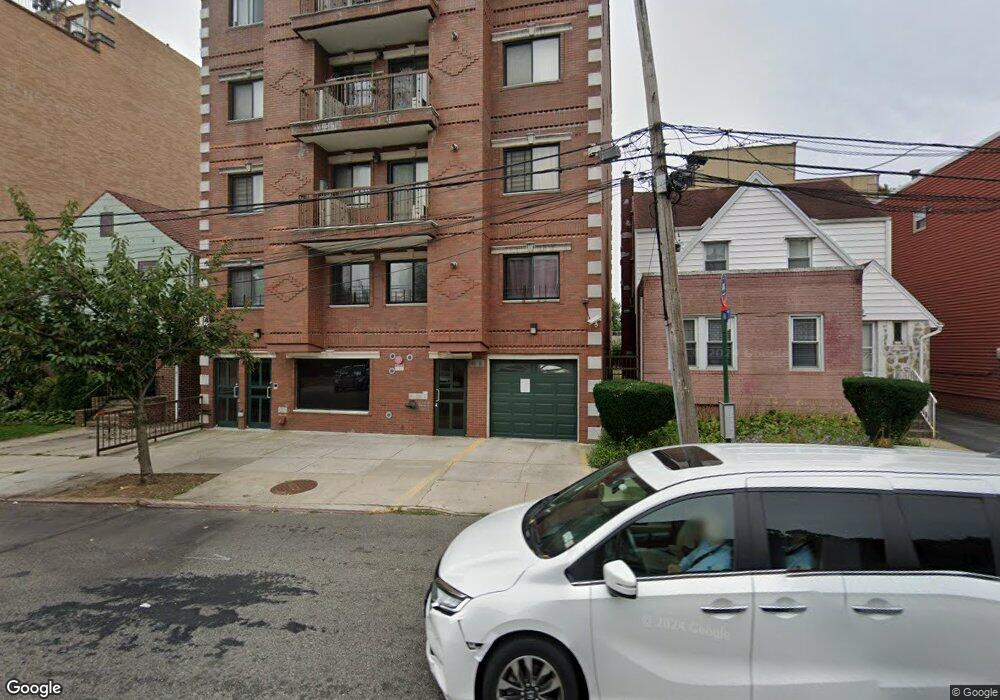
16210 71st Ave Unit 3B Fresh Meadows, NY 11365
Pomonok NeighborhoodEstimated Value: $417,000 - $490,000
--
Bed
--
Bath
736
Sq Ft
$623/Sq Ft
Est. Value
About This Home
This home is located at 16210 71st Ave Unit 3B, Fresh Meadows, NY 11365 and is currently estimated at $458,746, approximately $623 per square foot. 16210 71st Ave Unit 3B is a home located in Queens County with nearby schools including I.S. 250 - The Robert F. Kennedy Community Middle School.
Ownership History
Date
Name
Owned For
Owner Type
Purchase Details
Closed on
Jun 5, 2018
Sold by
San Simon
Bought by
Gong Xiaodong and Zhang Chi
Current Estimated Value
Home Financials for this Owner
Home Financials are based on the most recent Mortgage that was taken out on this home.
Original Mortgage
$345,000
Outstanding Balance
$297,106
Interest Rate
4.5%
Mortgage Type
New Conventional
Estimated Equity
$161,640
Purchase Details
Closed on
Jan 21, 2016
Sold by
Sonawane Hilda and Sonawane Vijay
Bought by
San Simon
Home Financials for this Owner
Home Financials are based on the most recent Mortgage that was taken out on this home.
Original Mortgage
$316,000
Interest Rate
4.02%
Mortgage Type
New Conventional
Purchase Details
Closed on
Jan 6, 2009
Sold by
71St Realty Inc
Bought by
Sonawane Hilda and Sonawane Vijay
Home Financials for this Owner
Home Financials are based on the most recent Mortgage that was taken out on this home.
Original Mortgage
$242,250
Interest Rate
5.51%
Mortgage Type
Purchase Money Mortgage
Create a Home Valuation Report for This Property
The Home Valuation Report is an in-depth analysis detailing your home's value as well as a comparison with similar homes in the area
Home Values in the Area
Average Home Value in this Area
Purchase History
| Date | Buyer | Sale Price | Title Company |
|---|---|---|---|
| Gong Xiaodong | $495,000 | -- | |
| Gong Xiaodong | $495,000 | -- | |
| San Simon | $395,000 | -- | |
| San Simon | $395,000 | -- | |
| Sonawane Hilda | $285,000 | -- | |
| Sonawane Hilda | $285,000 | -- |
Source: Public Records
Mortgage History
| Date | Status | Borrower | Loan Amount |
|---|---|---|---|
| Open | Gong Xiaodong | $345,000 | |
| Closed | Gong Xiaodong | $345,000 | |
| Previous Owner | San Simon | $316,000 | |
| Previous Owner | Sonawane Hilda | $242,250 |
Source: Public Records
Tax History Compared to Growth
Tax History
| Year | Tax Paid | Tax Assessment Tax Assessment Total Assessment is a certain percentage of the fair market value that is determined by local assessors to be the total taxable value of land and additions on the property. | Land | Improvement |
|---|---|---|---|---|
| 2025 | $8,437 | $70,205 | $11,031 | $59,174 |
| 2024 | $8,437 | $67,489 | $11,031 | $56,458 |
| 2023 | $6,448 | $64,158 | $11,031 | $53,127 |
| 2022 | $4,561 | $63,965 | $11,031 | $52,934 |
| 2021 | $2,859 | $56,399 | $11,031 | $45,368 |
| 2020 | $1,629 | $64,575 | $11,031 | $53,544 |
| 2019 | $157 | $62,856 | $11,031 | $51,825 |
| 2018 | $158 | $55,899 | $11,032 | $44,867 |
| 2017 | $158 | $54,279 | $11,031 | $43,248 |
| 2016 | $160 | $54,279 | $11,031 | $43,248 |
| 2015 | $125 | $49,062 | $11,031 | $38,031 |
| 2014 | $125 | $47,602 | $11,031 | $36,571 |
Source: Public Records
Map
Nearby Homes
- 71-33 162nd St Unit 4B
- 71-34 163rd St Unit 3
- 71-24 163rd St Unit 5A
- 7111 Sutton Place Unit 3
- 7129 Sutton Place Unit 3
- 71-18 Sutton Place Unit 3
- 71-28 Sutton Place Unit 3
- 163-07 72nd Ave Unit 5C
- 163-07 72nd Ave Unit 5A
- 163-07 72nd Ave Unit 2D
- 163-07 72nd Ave Unit 2G
- 163-07 72nd Ave Unit 4E
- 163-07 72nd Ave Unit 2C
- 163-07 72nd Ave Unit 5F
- 163-07 72nd Ave Unit 5b
- 163-07 72nd Ave Unit 2A
- 163-07 72nd Ave Unit 4H
- 72-05 164th St
- 7177 159th St Unit 3D
- 71-37 166th St
- 16210 71st Ave Unit 3C
- 16210 71st Ave Unit 6A
- 162-10 71st Ave Unit 3C
- 16210 71st Ave
- 16210 71st Ave Unit 6B
- 16210 71st Ave Unit 6A
- 16210 71st Ave Unit 5C
- 16210 71st Ave Unit 5B
- 16210 71st Ave Unit 5A
- 16210 71st Ave Unit 4C
- 16210 71st Ave Unit 4B
- 16210 71st Ave Unit 4A
- 16210 71st Ave Unit 3C
- 16210 71st Ave Unit 3A
- 16210 71st Ave Unit 2C
- 16210 71st Ave Unit 2B
- 16210 71st Ave Unit 2A
- 16210 71st Ave Unit 4B
- 16210 71st Ave Unit 5C
- 16210 71st Ave Unit 3A